. 2011 Oct;35(10):1402-8.
doi: 10.1016/j.leukres.2011.06.018. Epub 2011 Jul 8.

Plumbagin treatment leads to apoptosis in human K562 leukemia cells through increased ROS and elevated TRAIL receptor expression

Affiliations

Plumbagin treatment leads to apoptosis in human K562 leukemia cells through increased ROS and elevated TRAIL receptor expression

Jingping Sun et al. Leuk Res. 2011 Oct.

Abstract

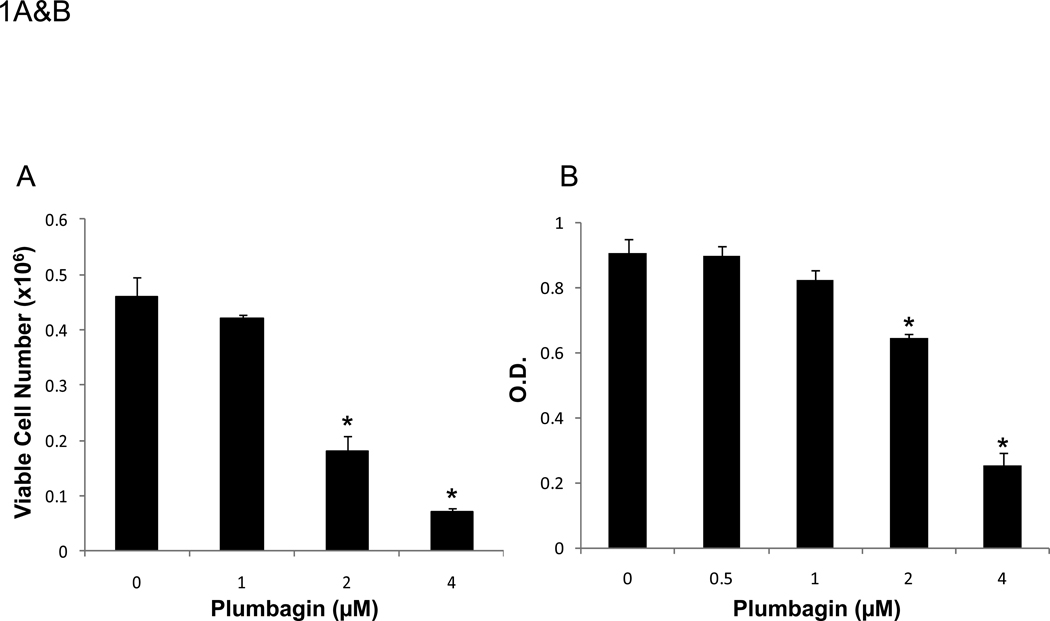
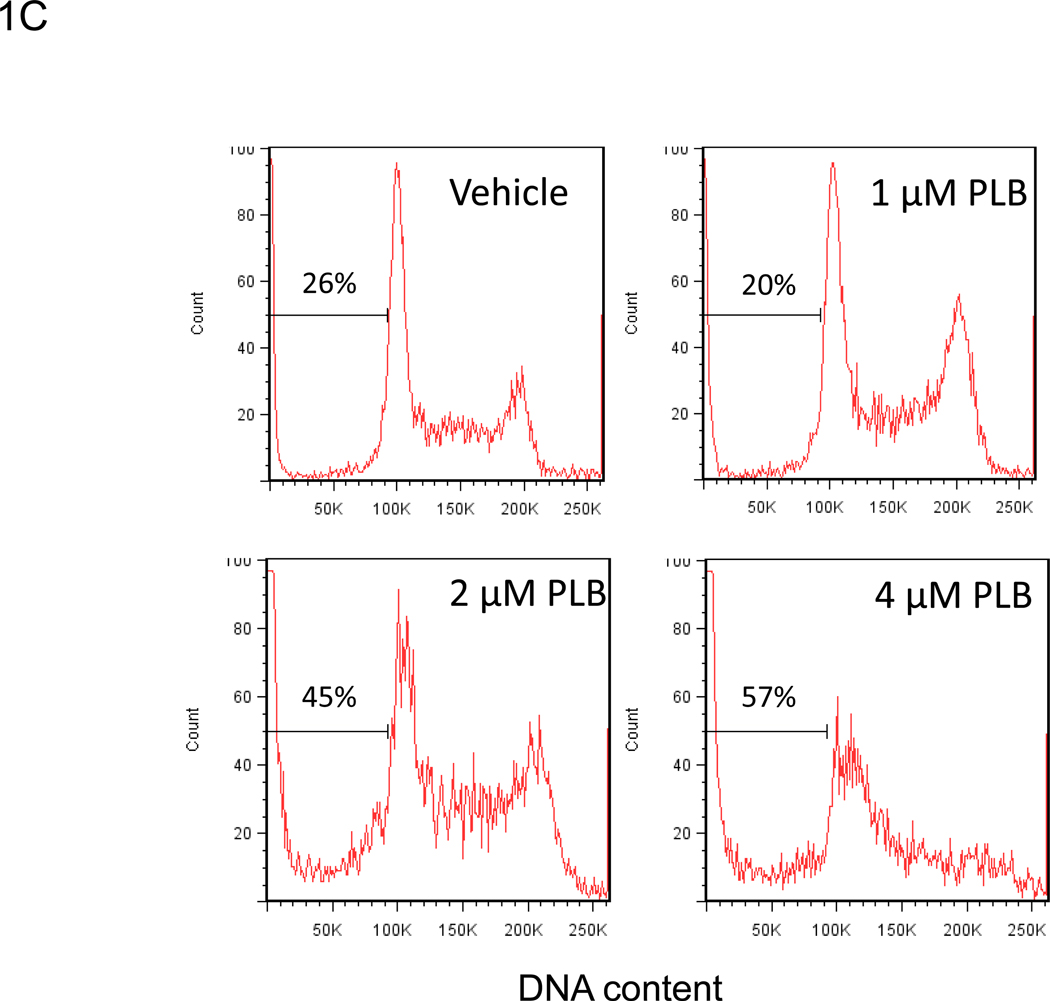
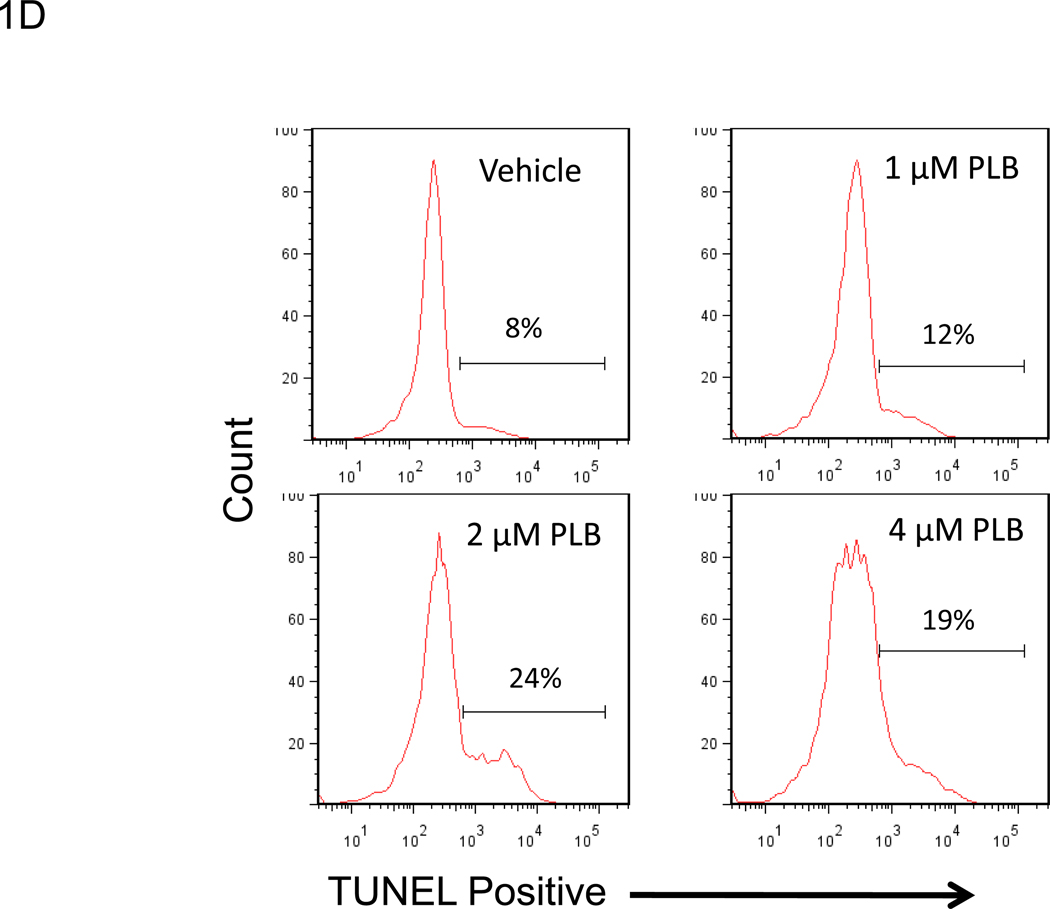
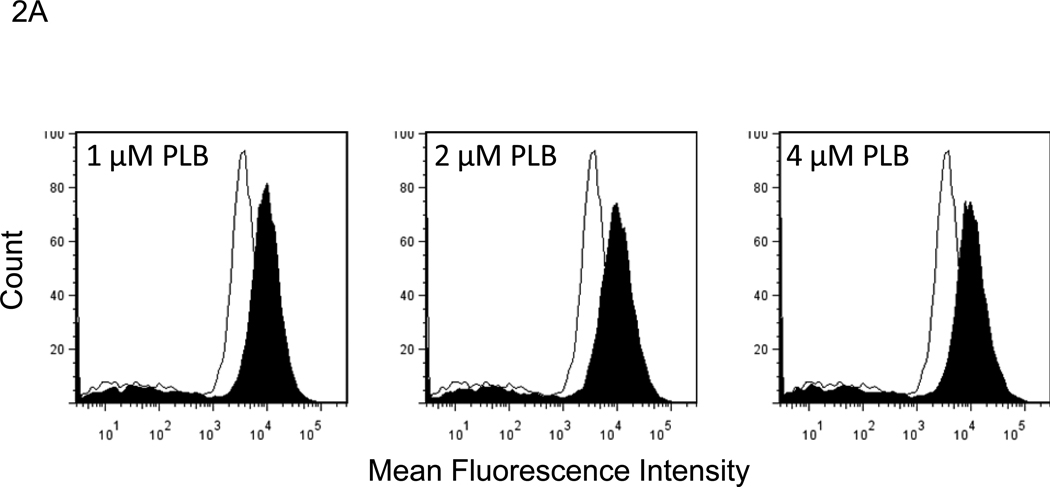
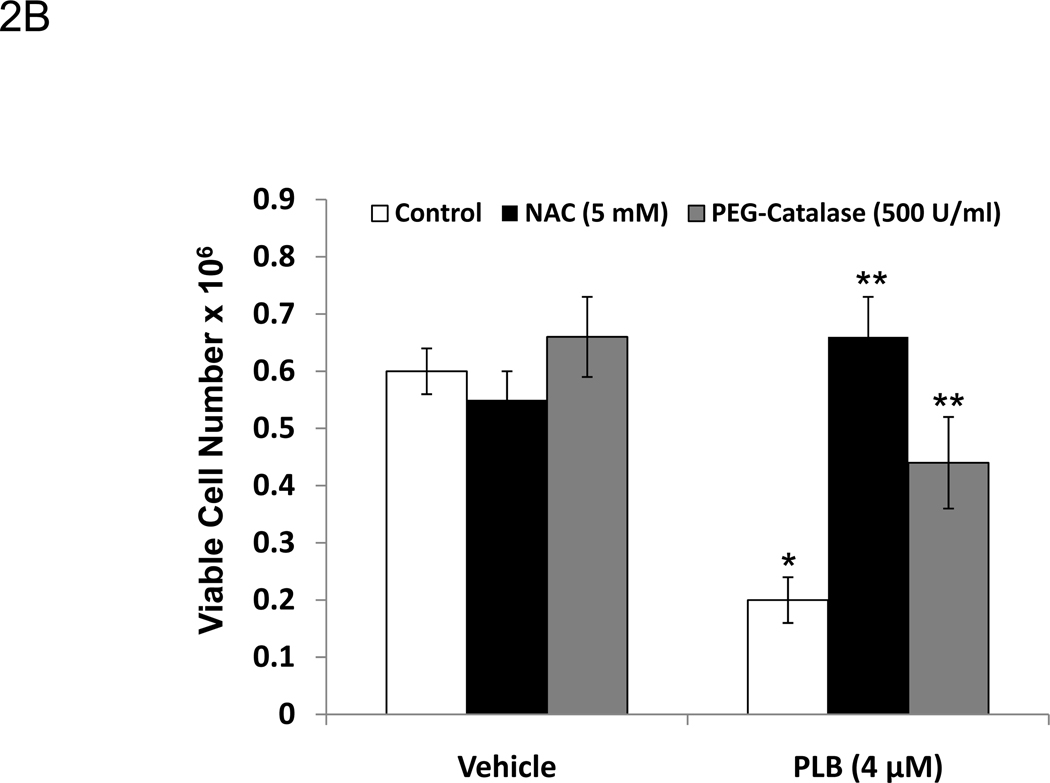
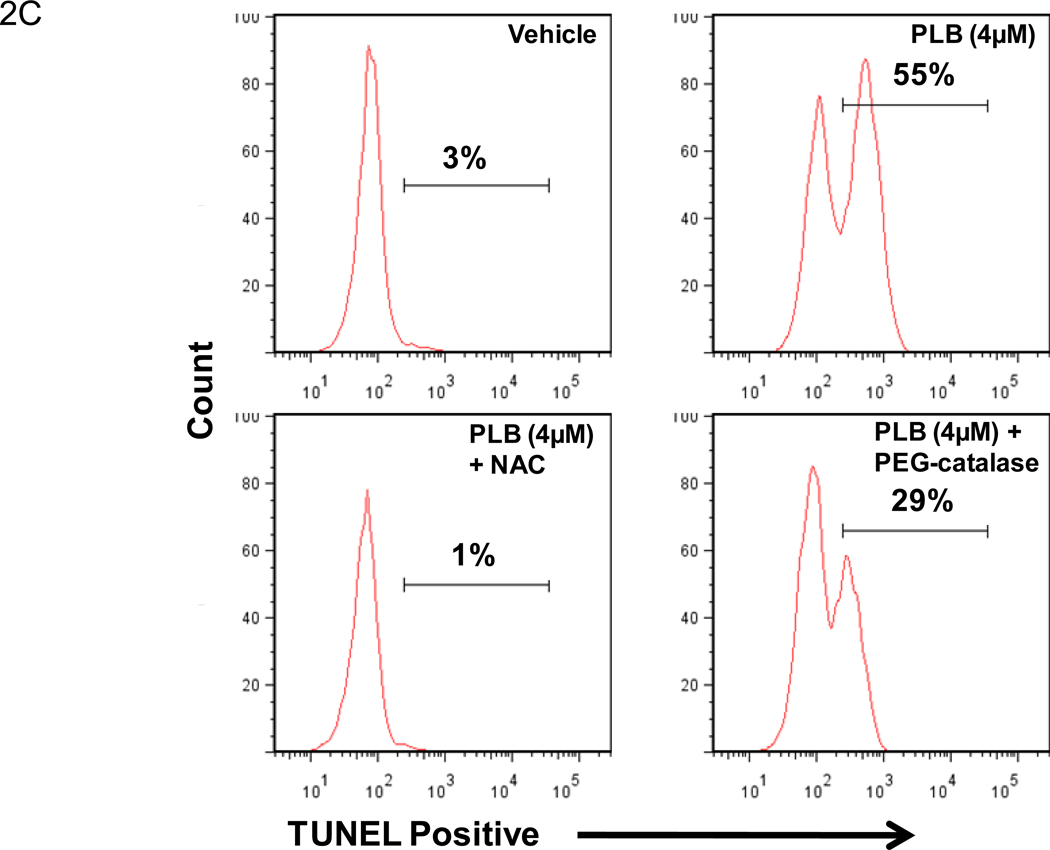
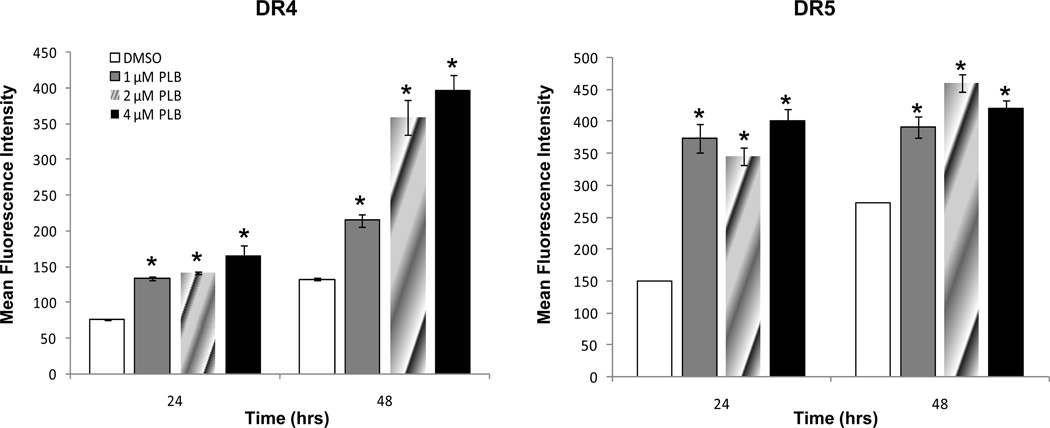
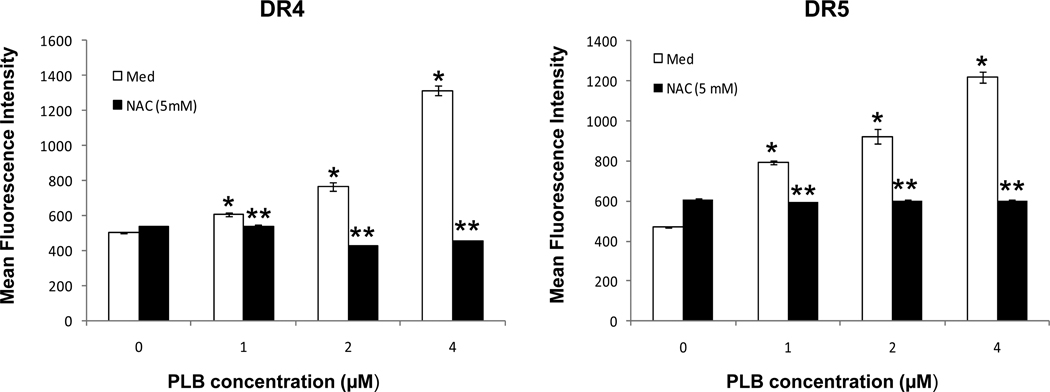
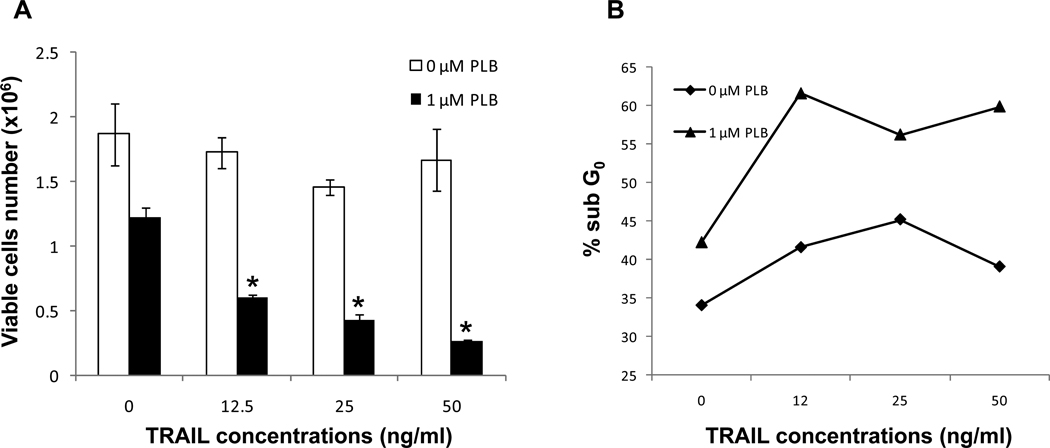
This study examined the ability of plumbagin to induce apoptosis in chronic myelogenous leukemia (CML). Plumbagin exposure led to a significant reduction in cell viability and the induction of apoptosis. Mechanistically, plumbagin treatment led to elevated levels of ROS. Plumbagin-induced apoptosis was inhibited by N-acetyl L-cysteine (NAC) and PEG-catalase. Furthermore, plumbagin exposure led to elevated expression of DR4 and DR5 and increased killing through soluble TRAIL. The plumbagin-induced increase in DR4 and DR5 was inhibited by treatment with NAC. Together, this study suggests that plumbagin may be an effective treatment of CML through increased sensitivity to TRAIL-mediated killing.


Conflict of interest statement

Conflicts of interest

The authors have no conflicts of interest to report

Figures

Figure 1
Figure 1. Treatment of the human chronic myelogenous leukemia cell line K562 with plumbagin leads to reduced cell viability through the induction of apoptosis
The effect of plumbagin on K562 viability was determined by treating cells with various concentrations of plumbagin (PLB). Cell viability was determined 24h later by Trypan blue dye exclusion (A) and MTT (B) assays. The data represent the mean ± SD. Asterisk denotes statistically significant difference (p<0.05) between vehicle (0 µM) and plumbagin treated cells. The effect of plumbagin treatment on the induction of apoptosis in K562 cells was determined by treating the cells with various concentrations of plumbagin for 24h and quantifying the percentage of sub G0 cells using cell cycle analysis (C) and the TUNEL assay (D).
Figure 2
Figure 2. Exposure to plumbagin leads to ROS-mediated apoptosis in K562 leukemia cells
The effect of plumbagin exposure on the intracellular levels of ROS in K562 cells was determined by exposing carboxy-H2DCFDA-labeled cells to various concentrations of plumbagin (A). ROS levels were determined 1h later by flow cytometric analysis. The data depict difference in the levels of intracellular ROS in control (open histograms) versus plumbagin (closed histograms) treated cells from a representative experiment. The role of ROS in plumbagin-mediated apoptosis was assessed using NAC and PEG-catalase. The effect of NAC and PEG-catalase on plumbagin-induced cytotoxicity was determined by trypan blue dye exclusion (B). The data represent the mean ± SD. Asterisk denotes statistically significant difference (p<0.05) between vehicle (0 µM PLB) and plumbagin treated cells. Double asterisk denotes statistically significant difference (p<0.05) between PLB and PLB + NAC-treated cells or between PLB and PLB + PEG-catalase-treated cells. Apoptosis was determined by TUNEL staining (C). Percentages depicted in Figure 2 C represent the percentage of apoptotic cells.
Figure 3
Figure 3. Plumbagin exposure leads to increased expression of TRAIL receptors in human chronic myelogenous leukemia cells
The effect of plumbagin treatment on the expression of The TRAIL receptors, DR4 and DR5 was determined by exposing K562 cells to various concentrations of plumbagin for 24. Trail receptor expression was determined by flow cytometric analysis. The data represent the mean fluorescence intensity (MFI) from a representative experiment which was repeated at least three times with similar results.
Figure 4
Figure 4. NAC treatment prevents plumbagin induced increase in DR4 and DR5 expression in human chronic myelogenous leukemia cells
The role of ROS in the plumbagin-mediated increase in DR4 and DR5 expression was assessed using NAC. More specifically, K562 cells were cultured in medium or treated with NAC (5mM). The cells were exposed to various concentrations of plumbagin for 24h and the expression of DR4 and DR5 were determined by flow cytometric analysis. The data represent the mean fluorescence intensity (MFI) from a representative experiment which was repeated at least three times with similar results.
Figure 5
Figure 5. Plumbagin sensitizes human chronic myelogenous leukemia cells to TRAIL-induced apoptosis
The effect of plumbagin on soluble TRAIL-mediated apoptosis in K562 was examined. To this end, K562 were treated with various concentrations of plumbagin (0 or 1 µM) in combination with various concentrations of soluble TRAIL (0–50 ng/ml). The tumor cells were harvested 24 hours later and the viable cell number and the induction of apoptosis were determined by Trypan blue dye exclusion (Figure 5A) and cell cycle analysis (Figure 5B), respectively. The data represent the mean ± SD. Asterisk denotes statistically significant difference (p<0.05) between vehicle (0 µM PLB) and plumbagin treated cells. Cell cycle analysis data represent the percentage of apoptotic cells (Sub G0) from a representative experiment.

Similar articles

Cited by

References

    1. Pitti RM, Marsters SA, Ruppert S, Donahue CJ, Moore A, Ashkenazi A. Induction of apoptosis by Apo-2 ligand, a new member of the tumor necrosis factor cytokine family. J Biol Chem. 1996 May 31;271(22):12687–12690. - PubMed
    1. Wiley SR, Schooley K, Smolak PJ, Din WS, Huang CP, Nicholl JK, et al. Identification and characterization of a new member of the TNF family that induces apoptosis. Immunity. 1995 Dec;3(6):673–682. - PubMed
    1. El-Deiry WS. Insights into cancer therapeutic design based on p53 and TRAIL receptor signaling. Cell Death Differ. 2001 Nov;8(11):1066–1075. - PubMed
    1. Lowe SW, Ruley HE, Jacks T, Housman DE. p53-dependent apoptosis modulates the cytotoxicity of anticancer agents. Cell. 1993 Sep 24;74(6):957–967. - PubMed
    1. Lowe SW, Schmitt EM, Smith SW, Osborne BA, Jacks T. p53 is required for radiation-induced apoptosis in mouse thymocytes. Nature. 1993 Apr 29;362(6423):847–849. - PubMed

MeSH terms