Examining five- and ten-year survival in older women with breast cancer using cancer-specific geriatric assessment
- PMID: 21741826
- PMCID: PMC3196774
- DOI: 10.1016/j.ejca.2011.06.016
Examining five- and ten-year survival in older women with breast cancer using cancer-specific geriatric assessment
Abstract
Purpose: To examine five- and ten-year survival based on cancer-specific geriatric assessment (C-SGA) in older women with early stage breast cancer.
Methods: We evaluated 660 women ≥65-years old diagnosed with stage I-IIIA primary breast cancer and attending physician permission to contact in four geographic regions in the United States of America (USA). Data were collected over ten-years of follow-up from consenting women's medical records, telephone interviews, National Death Index and Social Security Death Index. C-SGA was described by four domains using six measures: socio-demographic (financial resources); clinical (comorbidity, obesity); function (physical function limitations); and psychosocial (general mental health, social support). Survival from all-cause and breast-cancer-specific mortality and receipt of guideline-recommended therapy was assessed for different groups of subjects with C-SGA domain deficits (cut-off ≥3 deficits).
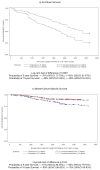
Results: The proportion of women with ≥3 C-SGA deficits surviving ten-years was consistently statistically significantly lower (all-cause 26% versus 46% and breast-cancer-specific 76% versus 89%, p≤0.04). The proportion significantly decreased as number of C-SGA deficits increased (linear trend p<0.0001). Receipt of guideline-recommended therapy decreased with age but not consistently by number of C-SGA deficits. The all-cause and breast-cancer-specific death rate at five- and ten-years was consistently approximately two times higher in women with ≥3 C-SGA deficits even when fully adjusted for confounding factors (HR(5-yrAllCauseFullyAdjusted)=1.87 [1.36-2.57], HR(10-yrAllCauseFullyAdjusted)=1.74 [1.35-2.15], HR(5-yrBreastCancerFullyAdjusted)=1.95 [1.18-3.20], HR(10-yrBreastCancerFullyAdjusted)=1.99 [1.21-3.28]).
Conclusion: Regardless of age and stage of disease, C-SGA predicts five- and ten-year all-cause and breast-cancer-specific survival in older women. Hence, C-SGA may provide an effective strategy to guide treatment decision-making and to identify risk factors for intervention.
Copyright © 2011 Elsevier Ltd. All rights reserved.
Conflict of interest statement
Figures


References
-
- Breast Cancer Facts & Figures. Atlanta, GA: 2009–2010.
-
- Lash TL, Silliman RA. Re: prevalence of cancer. J Natl Cancer Inst. 1998;90(5):399–400. - PubMed
-
- Reis L, Melbert D, Krapcho M, Stinchcomb DG, Howlader N, Horner MJ, et al. SEER Cancer Statistics Review, 1975–2005. Bethesda, MD: National Cancer Institute; 2008.
-
- Hurria A, Lichtman SM, Gardes J, Li D, Limaye S, Patil S, et al. Identifying vulnerable older adults with cancer: integrating geriatric assessment into oncology practice. J Am Geriatr Soc. 2007;55(10):1604–8. - PubMed
-
- Balducci L, Beghe C. Cancer and age in the USA. Crit Rev Oncol Hematol. 2001;37(2):137–45. - PubMed
Publication types
MeSH terms
Grants and funding
LinkOut - more resources
Full Text Sources
Medical

