

Early changes in natural killer cell function indicate virologic response to interferon therapy for hepatitis C
- PMID: 21741920
- PMCID: PMC3353552
- DOI: 10.1053/j.gastro.2011.06.069
Early changes in natural killer cell function indicate virologic response to interferon therapy for hepatitis C
Abstract
Background & aims: Mathematical modeling of hepatitis C virus (HCV) kinetics indicated that cellular immune responses contribute to interferon (IFN)-induced clearance of HCV. We investigated a potential role of natural killer (NK) cells in this process.
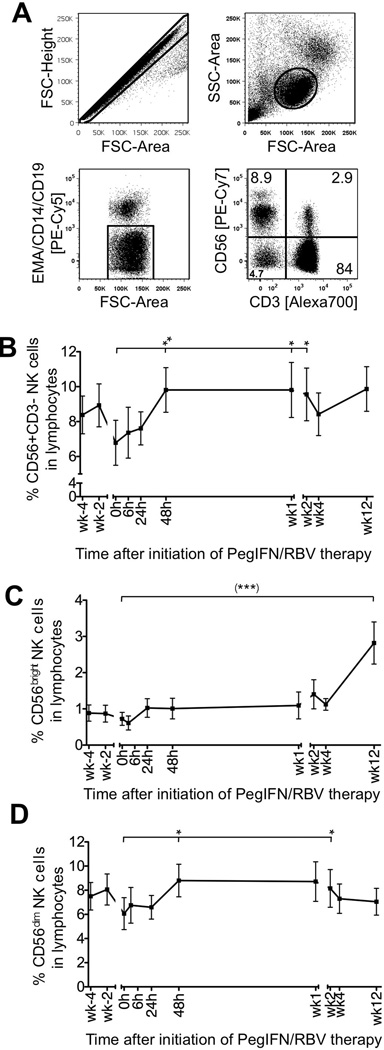
Methods: Phenotype and function of blood and liver NK cells were studied during the first 12 weeks of treatment with pegylated IFN-alfa and ribavirin, the time period used to define the early virological response.
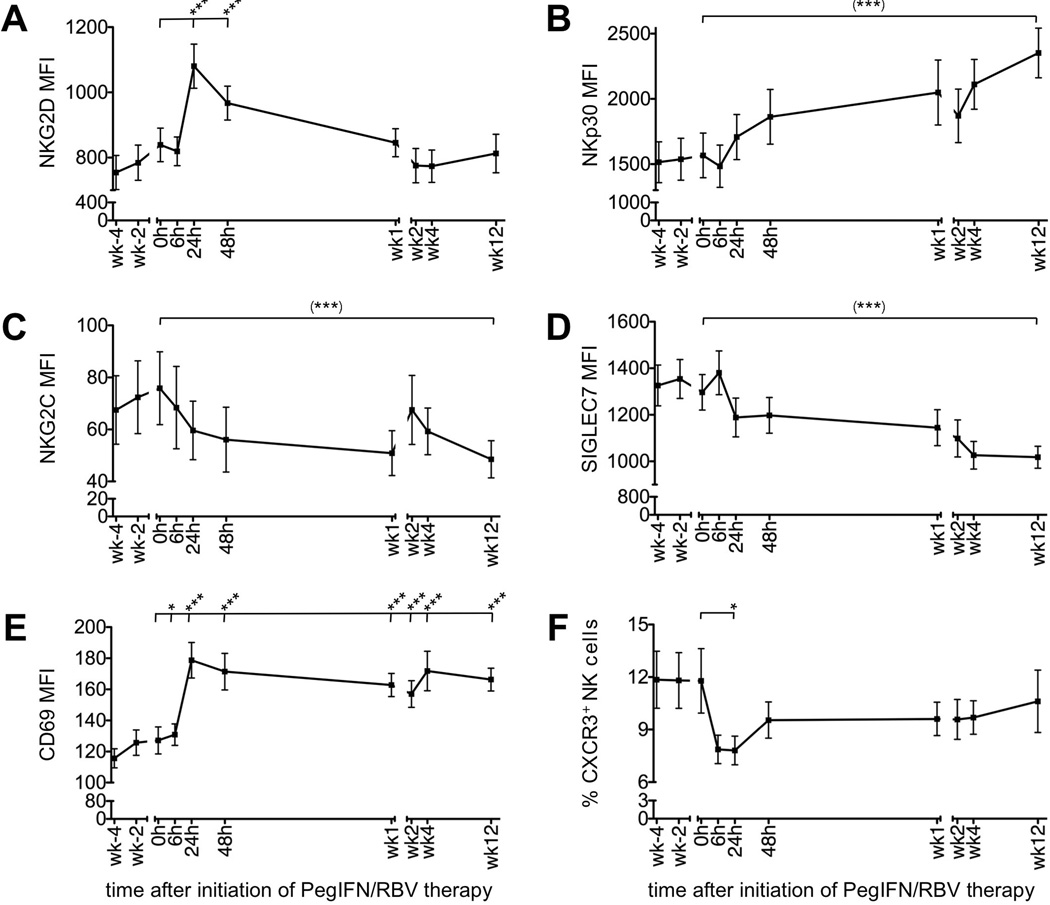
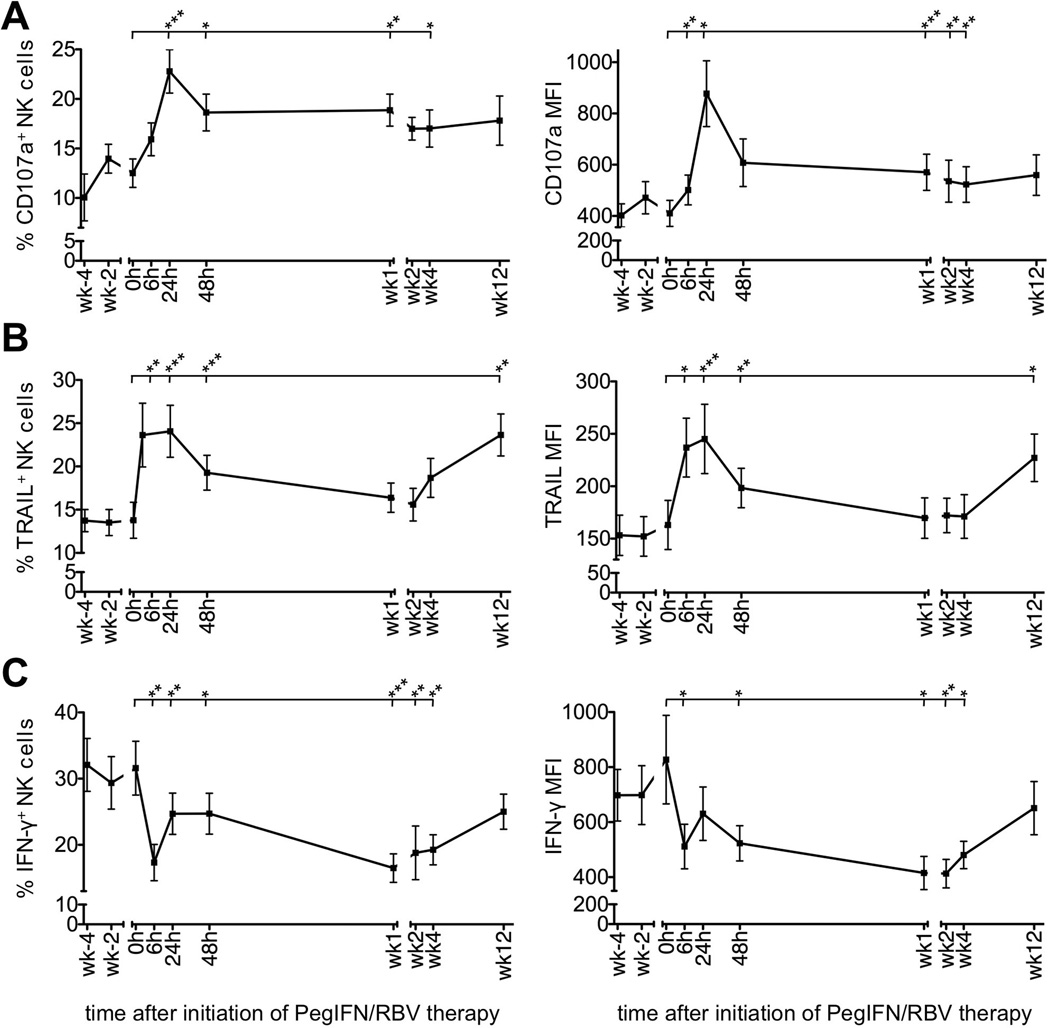
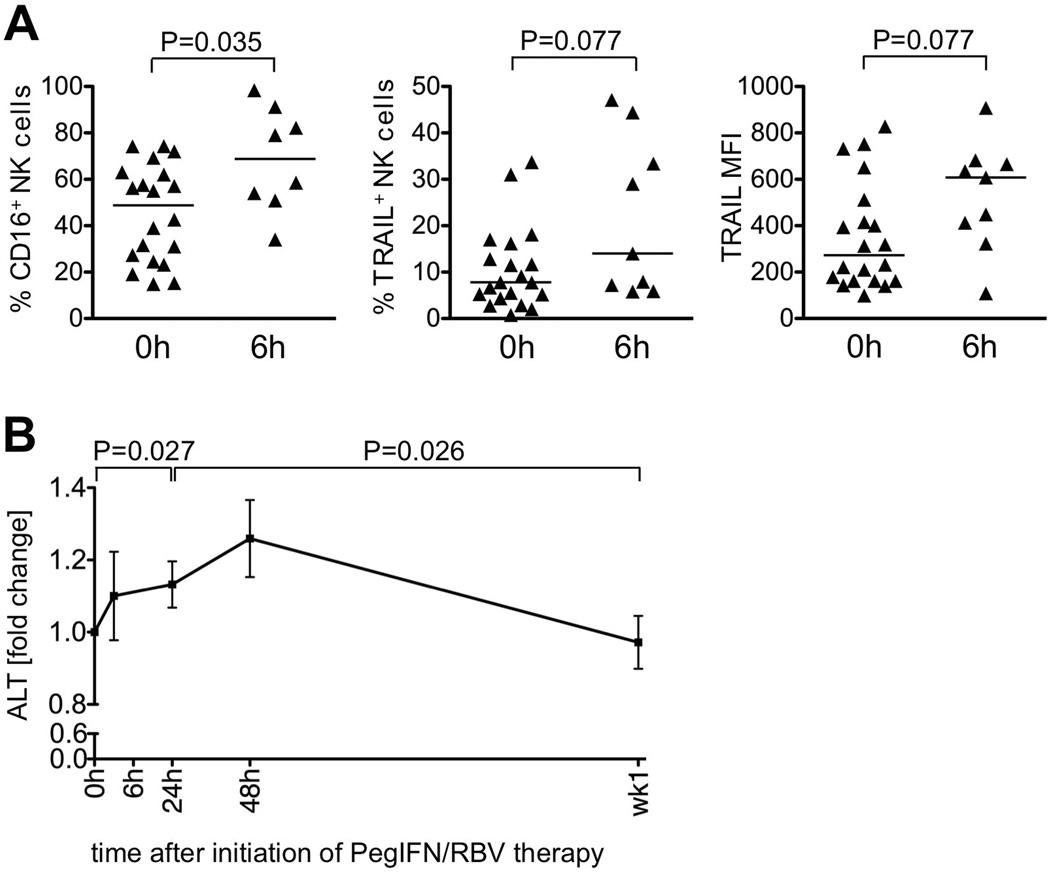
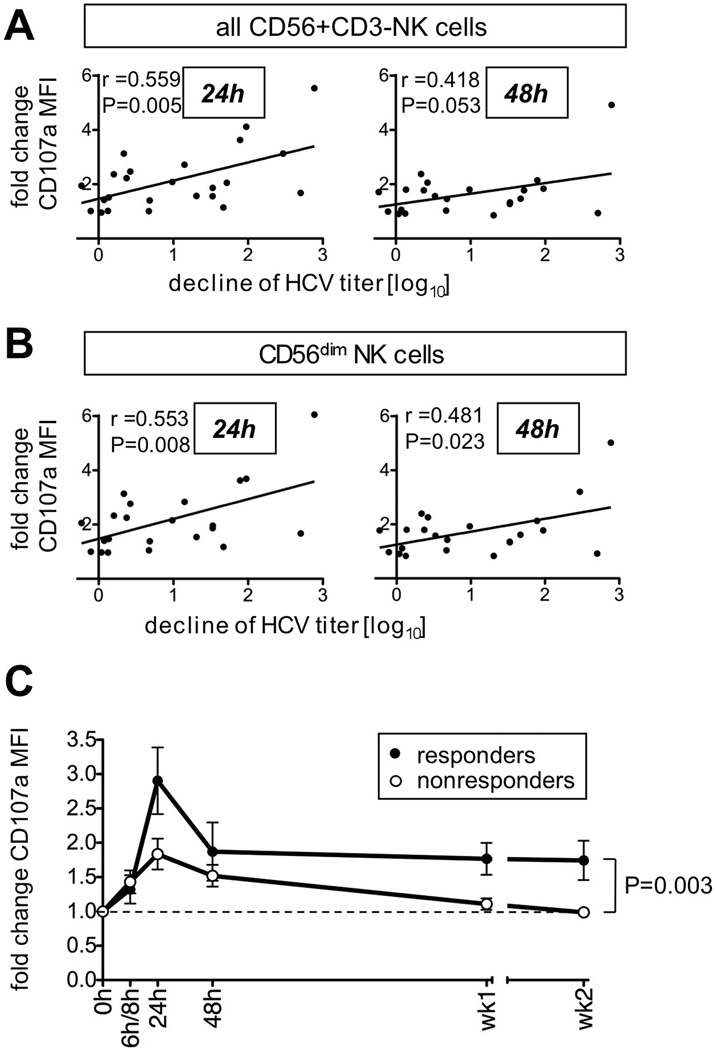
Results: Within hours of treatment initiation, NK cells of patients that had an early virological response increased expression of activating receptors NKG2D, NKp30, and CD16 and decreased expression of NKG2C and 2B4, along with inhibitory receptors SIGLEC7 and NKG2A, resulting in NK cell activation. NK cell cytotoxicity, measured by degranulation and tumor necrosis factor-related apoptosis-inducing ligand production, peaked after 24 hours (P<.01), concomitant with an increase in alanine aminotransferase levels (P<.05), whereas IFN-γ production decreased within 6 hours and did not recover for more than 4 weeks (P<.05). NK cells from liver biopsies taken 6 hours after treatment initiation had increased numbers of cytotoxic CD16+NK cells (P<.05) and a trend toward increased production of tumor necrosis factor-related apoptosis-inducing ligand. Degranulation of peripheral blood NK cells correlated with treatment-induced, first-phase decreases in viral load (P<.05) and remained higher in early virological responders than in nonresponders for weeks.
Conclusions: IFN activates NK cells early after treatment is initiated. Their cytotoxic function, in particular, is strongly induced, which correlates to virologic response. Therefore, NK cell activation indicates responsiveness to IFN-α-based treatment and suggests the involvement of the innate immune cells in viral clearance.
Copyright © 2011 AGA Institute. Published by Elsevier Inc. All rights reserved.
Conflict of interest statement
Figures
Comment in
-
A view to natural killer cells in hepatitis C.Gastroenterology. 2011 Oct;141(4):1144-8. doi: 10.1053/j.gastro.2011.08.025. Epub 2011 Aug 27. Gastroenterology. 2011. PMID: 21875586 No abstract available.
References
-
- Ciesek S, Manns MP. Hepatitis in 2010: The dawn of a new era in HCV therapy. Nat Rev Gastroenterol Hepatol. 2011;8:69–71. - PubMed
-
- Layden TJ, Mika B, Wiley TE. Hepatitis C kinetics: mathematical modeling of viral response to therapy. Semin Liver Dis. 2000;20:173–183. - PubMed
-
- Norris S, Collins C, Doherty DG, Smith F, McEntee G, Traynor O, Nolan N, Hegarty J, O'Farrelly C. Resident human hepatic lymphocytes are phenotypically different from circulating lymphocytes. J Hepatol. 1998;28:84–90. - PubMed
-
- Biron CA, Nguyen KB, Pien GC, Cousens LP, Salazar-Mather TP. Natural killer cells in antiviral defense: function and regulation by innate cytokines. Annu Rev Immunol. 1999;17:189–220. - PubMed
Publication types
MeSH terms
Substances
Grants and funding
LinkOut - more resources
Full Text Sources
Other Literature Sources
Medical
Research Materials
