

Modeling of biopterin-dependent pathways of eNOS for nitric oxide and superoxide production
- PMID: 21742028
- PMCID: PMC3184605
- DOI: 10.1016/j.freeradbiomed.2011.06.009
Modeling of biopterin-dependent pathways of eNOS for nitric oxide and superoxide production
Abstract
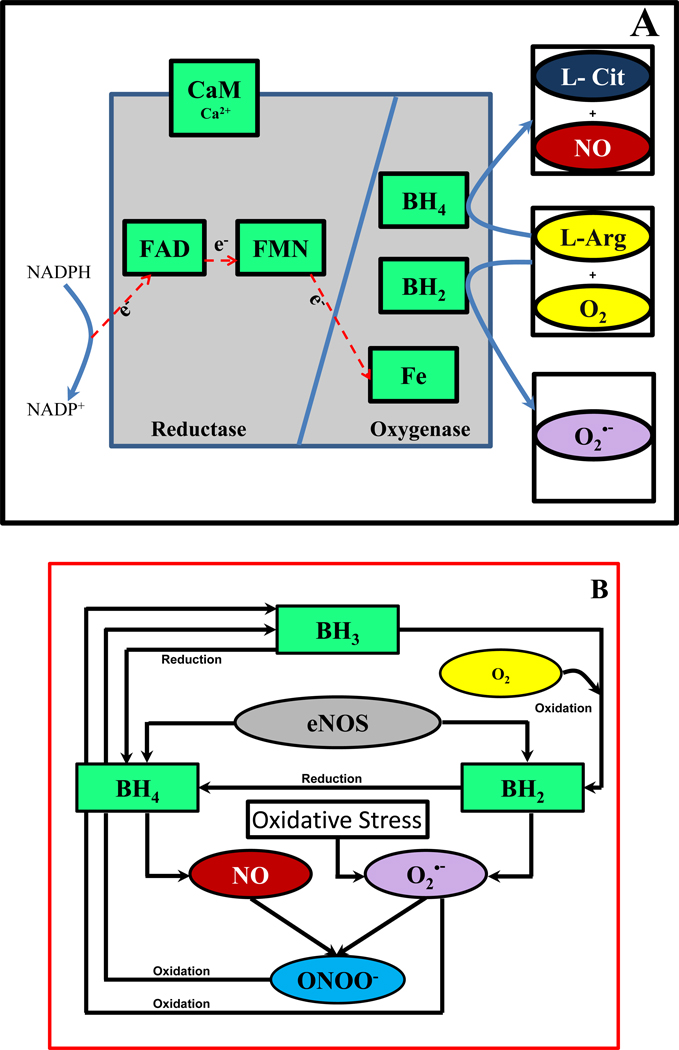
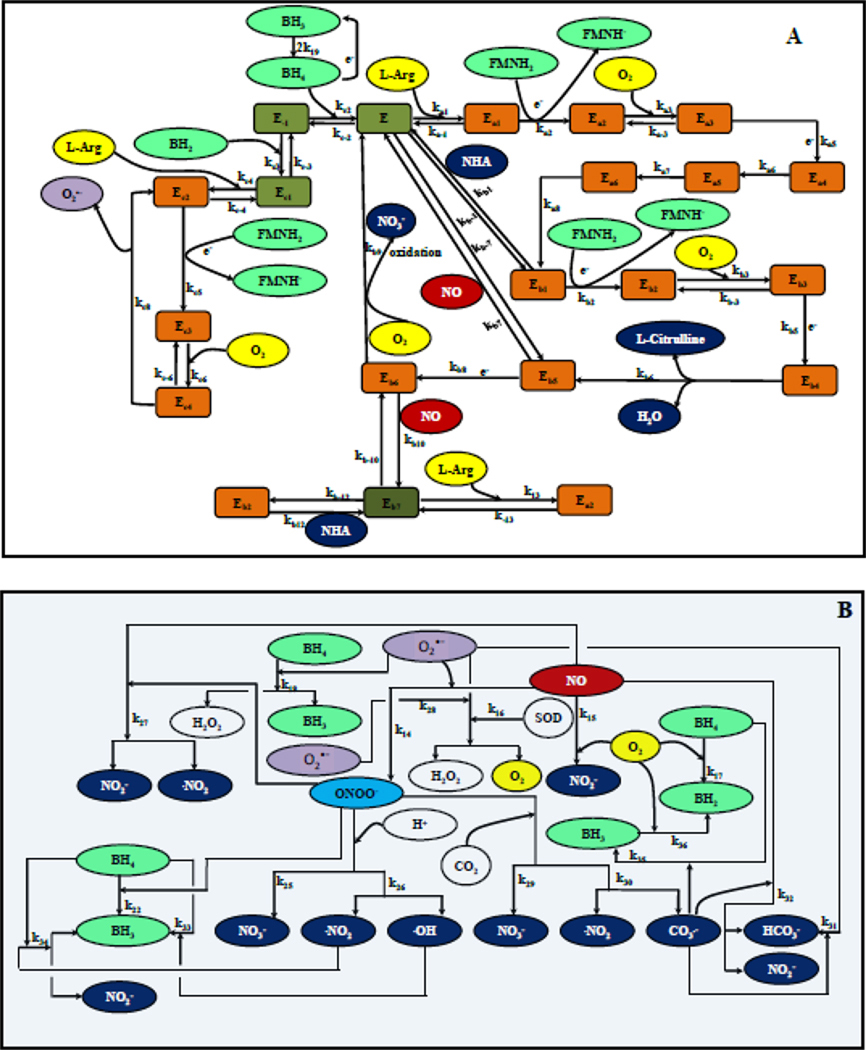
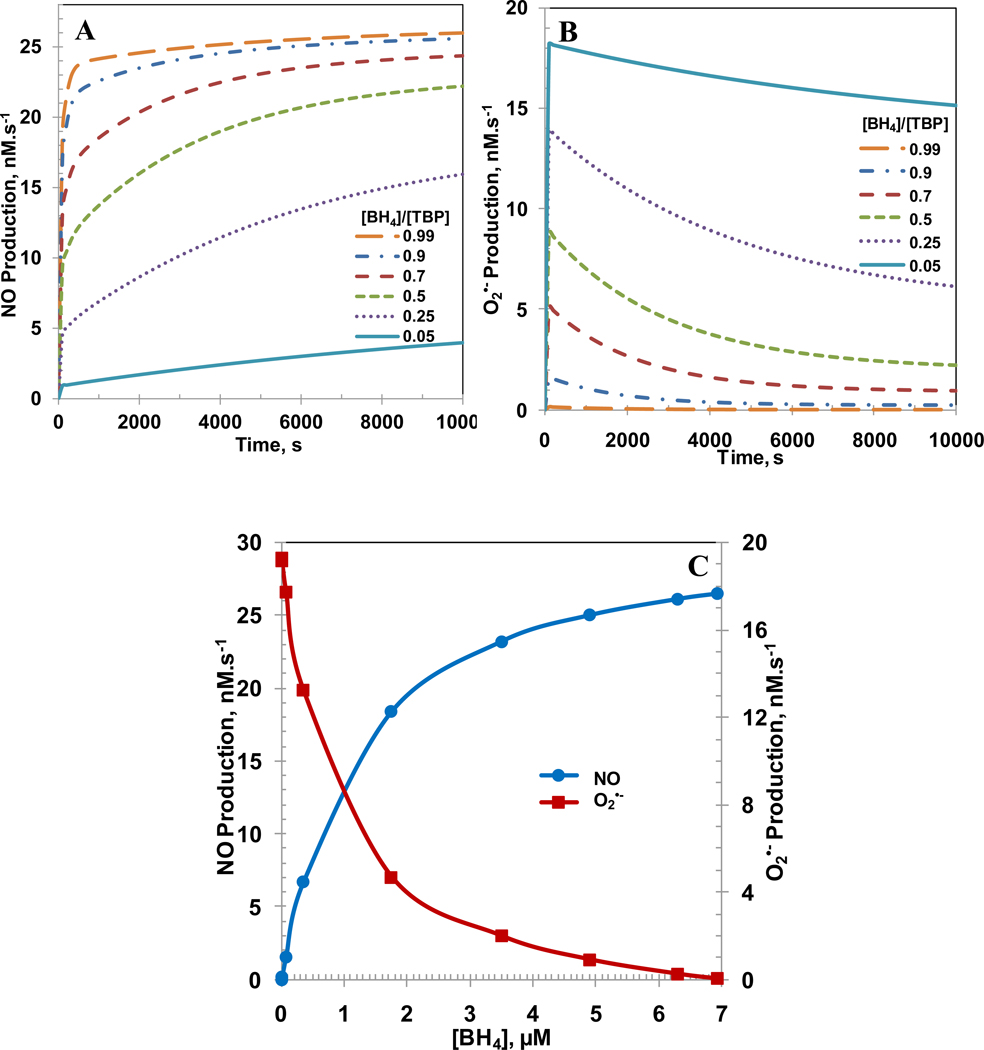
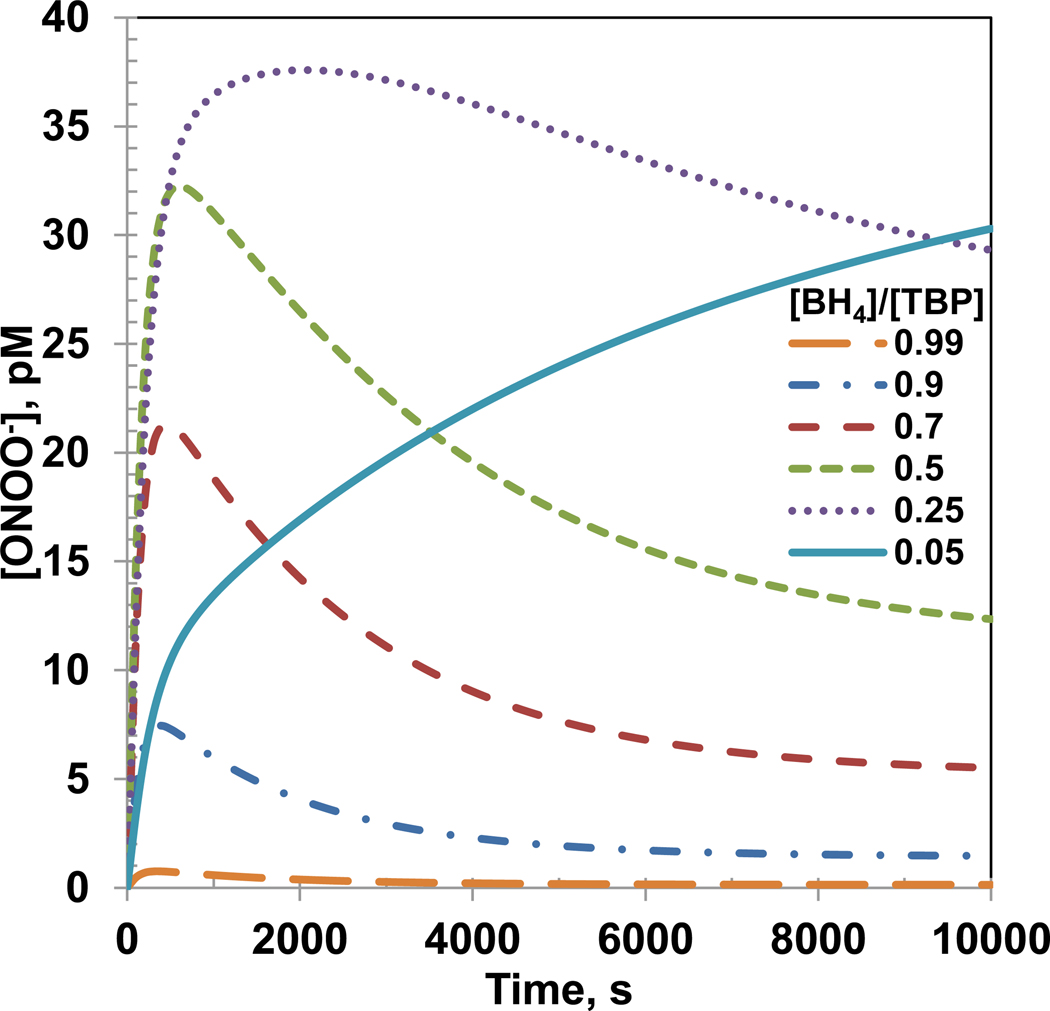
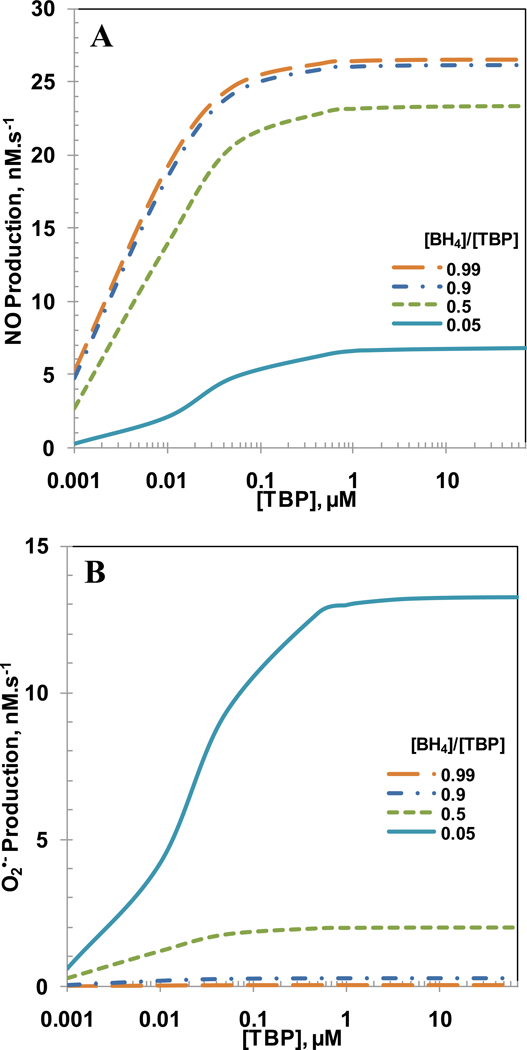
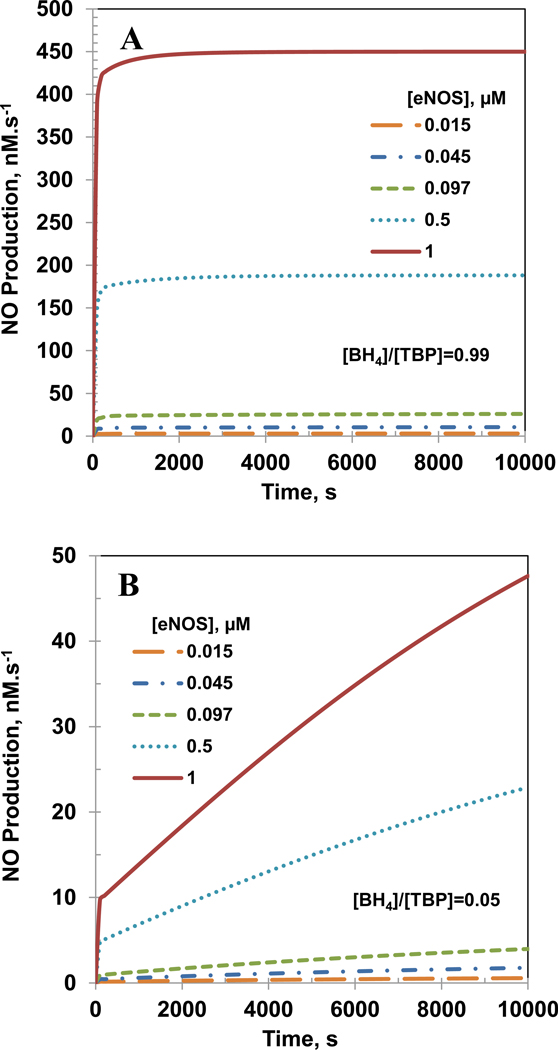
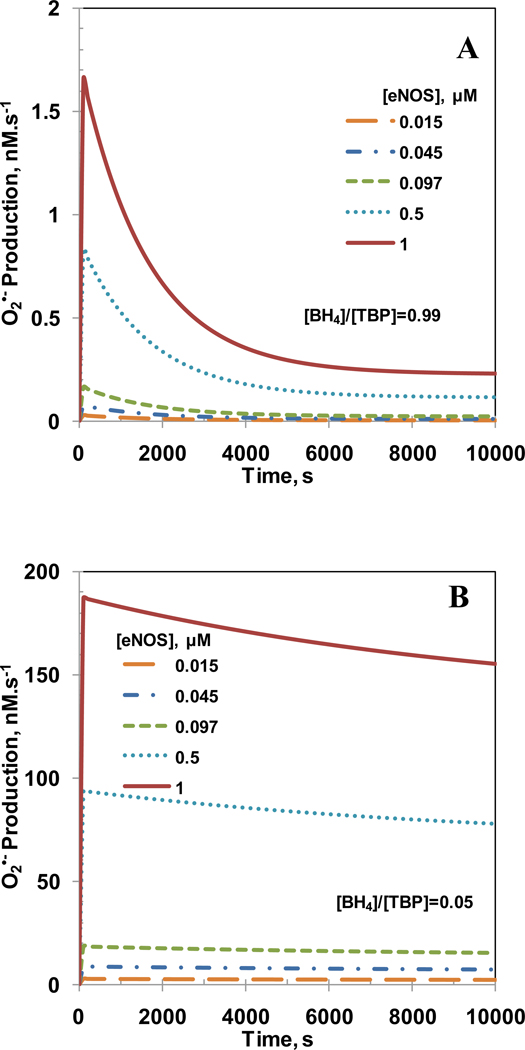
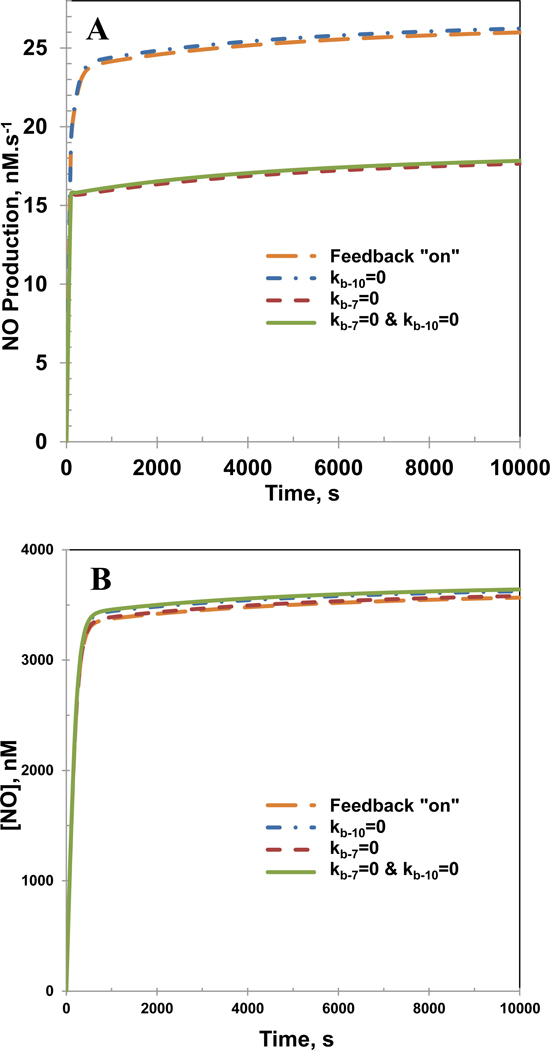
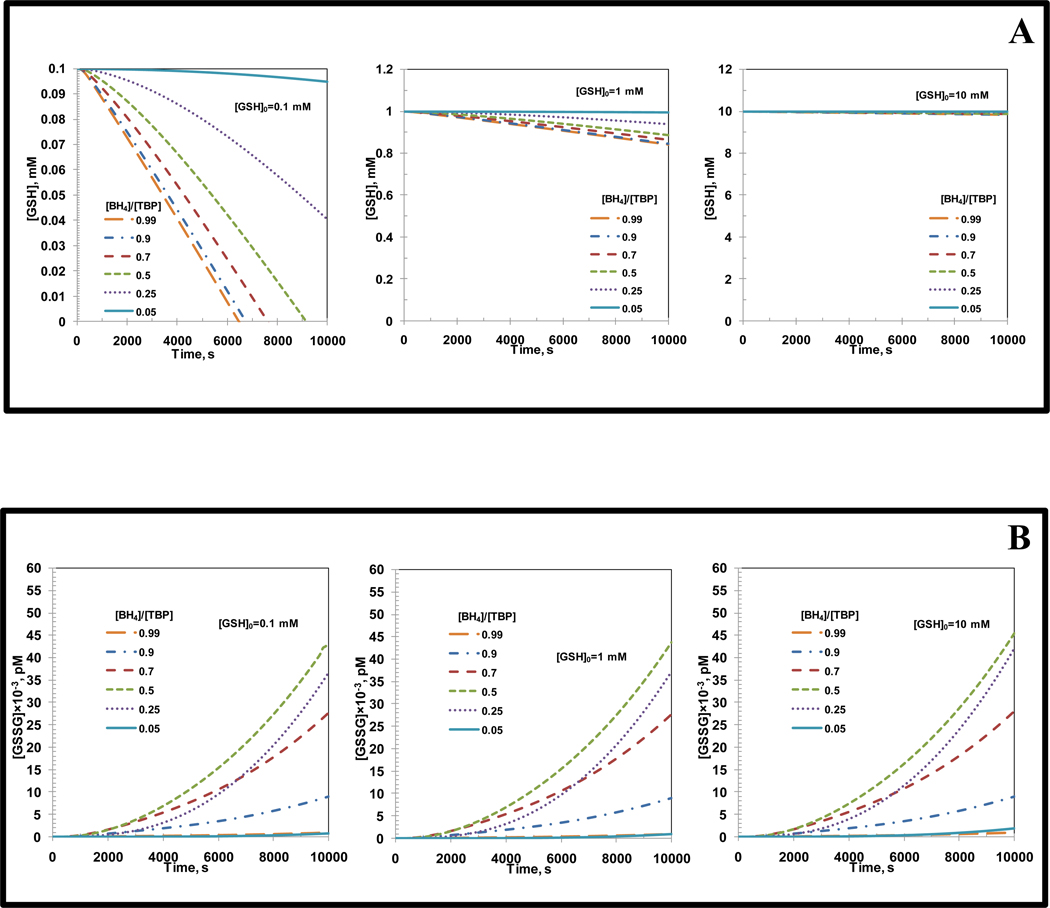
Endothelial dysfunction is associated with increase in oxidative stress and low NO bioavailability. The endothelial NO synthase (eNOS) uncoupling is considered an important factor in endothelial cell oxidative stress. Under increased oxidative stress, the eNOS cofactor tetrahydrobiopterin (BH(4)) is oxidized to dihydrobiopterin, which competes with BH(4) for binding to eNOS, resulting in eNOS uncoupling and reduction in NO production. The importance of the ratio of BH(4) to oxidized biopterins versus absolute levels of total biopterin in determining the extent of eNOS uncoupling remains to be determined. We have developed a computational model to simulate the kinetics of the biochemical pathways of eNOS for both NO and O(2)(•-) production to understand the roles of BH(4) availability and total biopterin (TBP) concentration in eNOS uncoupling. The downstream reactions of NO, O(2)(•-), ONOO(-), O(2), CO(2), and BH(4) were also modeled. The model predicted that a lower [BH(4)]/[TBP] ratio decreased NO production but increased O(2)(•-) production from eNOS. The NO and O(2)(•-) production rates were independent above 1.5μM [TBP]. The results indicate that eNOS uncoupling is a result of a decrease in [BH(4)]/[TBP] ratio, and a supplementation of BH(4) might be effective only when the [BH(4)]/[TBP] ratio increases. The results from this study will help us understand the mechanism of endothelial dysfunction.
Copyright © 2011 Elsevier Inc. All rights reserved.
Figures
Similar articles
-
Ratio of 5,6,7,8-tetrahydrobiopterin to 7,8-dihydrobiopterin in endothelial cells determines glucose-elicited changes in NO vs. superoxide production by eNOS.Am J Physiol Heart Circ Physiol. 2008 Apr;294(4):H1530-40. doi: 10.1152/ajpheart.00823.2007. Epub 2008 Jan 11. Am J Physiol Heart Circ Physiol. 2008. PMID: 18192221 Free PMC article.
-
Suppression of eNOS-derived superoxide by caveolin-1: a biopterin-dependent mechanism.Am J Physiol Heart Circ Physiol. 2011 Sep;301(3):H903-11. doi: 10.1152/ajpheart.00936.2010. Epub 2011 Jul 1. Am J Physiol Heart Circ Physiol. 2011. PMID: 21724868 Free PMC article.
-
Computational analysis of interactions of oxidative stress and tetrahydrobiopterin reveals instability in eNOS coupling.Microvasc Res. 2017 Nov;114:114-128. doi: 10.1016/j.mvr.2017.07.001. Epub 2017 Jul 18. Microvasc Res. 2017. PMID: 28729163
-
Does vitamin C enhance nitric oxide bioavailability in a tetrahydrobiopterin-dependent manner? In vitro, in vivo and clinical studies.Nitric Oxide. 2014 Jan 30;36:51-7. doi: 10.1016/j.niox.2013.12.001. Epub 2013 Dec 9. Nitric Oxide. 2014. PMID: 24333161 Review.
-
Mechanisms and consequences of endothelial nitric oxide synthase dysfunction in hypertension.J Hypertens. 2015 Jun;33(6):1128-36. doi: 10.1097/HJH.0000000000000587. J Hypertens. 2015. PMID: 25882860 Free PMC article. Review.
Cited by
-
A kinetic platform to determine the fate of nitric oxide in Escherichia coli.PLoS Comput Biol. 2013;9(5):e1003049. doi: 10.1371/journal.pcbi.1003049. Epub 2013 May 2. PLoS Comput Biol. 2013. PMID: 23658508 Free PMC article.
-
Circuits Regulating Superoxide and Nitric Oxide Production and Neutralization in Different Cell Types: Expression of Participating Genes and Changes Induced by Ionizing Radiation.Antioxidants (Basel). 2020 Aug 3;9(8):701. doi: 10.3390/antiox9080701. Antioxidants (Basel). 2020. PMID: 32756515 Free PMC article.
-
Hyperglycemia induces differential change in oxidative stress at gene expression and functional levels in HUVEC and HMVEC.Cardiovasc Diabetol. 2013 Oct 5;12:142. doi: 10.1186/1475-2840-12-142. Cardiovasc Diabetol. 2013. PMID: 24093550 Free PMC article.
-
Aerobic Exercises Induce Antioxidant Pathways Activation in Rats.Int J Prev Med. 2020 Sep 5;11:144. doi: 10.4103/ijpvm.IJPVM_246_19. eCollection 2020. Int J Prev Med. 2020. PMID: 33088472 Free PMC article.
-
Endothelial dysfunction and myocardial injury after major emergency abdominal surgery: a prospective cohort study.BMC Anesthesiol. 2020 Mar 16;20(1):67. doi: 10.1186/s12871-020-00977-0. BMC Anesthesiol. 2020. PMID: 32178626 Free PMC article.
References
Publication types
MeSH terms
Substances
Grants and funding
LinkOut - more resources
Full Text Sources
