. 2011 Oct;123(2):523-41.
doi: 10.1093/toxsci/kfr179. Epub 2011 Jul 8.

Chelation of lysosomal iron protects dopaminergic SH-SY5Y neuroblastoma cells from hydrogen peroxide toxicity by precluding autophagy and Akt dephosphorylation

Affiliations

Chelation of lysosomal iron protects dopaminergic SH-SY5Y neuroblastoma cells from hydrogen peroxide toxicity by precluding autophagy and Akt dephosphorylation

Roberta Castino et al. Toxicol Sci. 2011 Oct.

Abstract

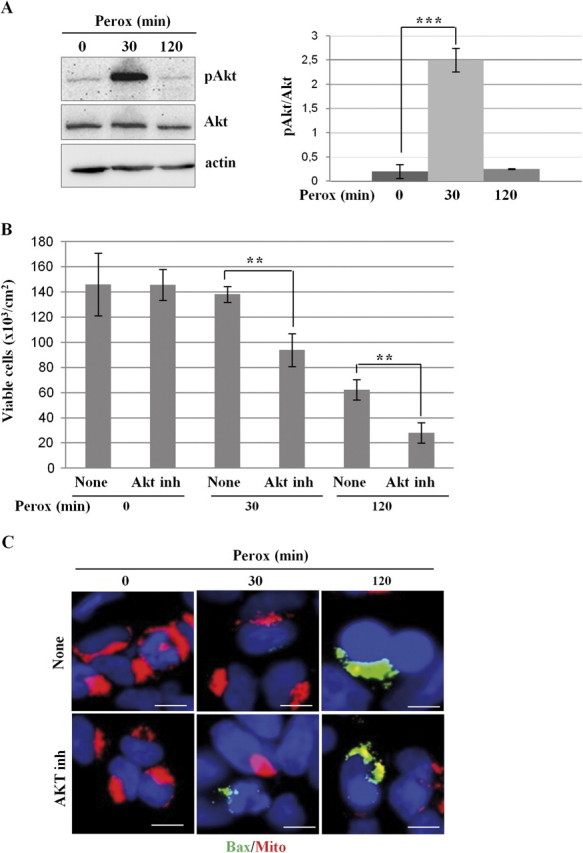
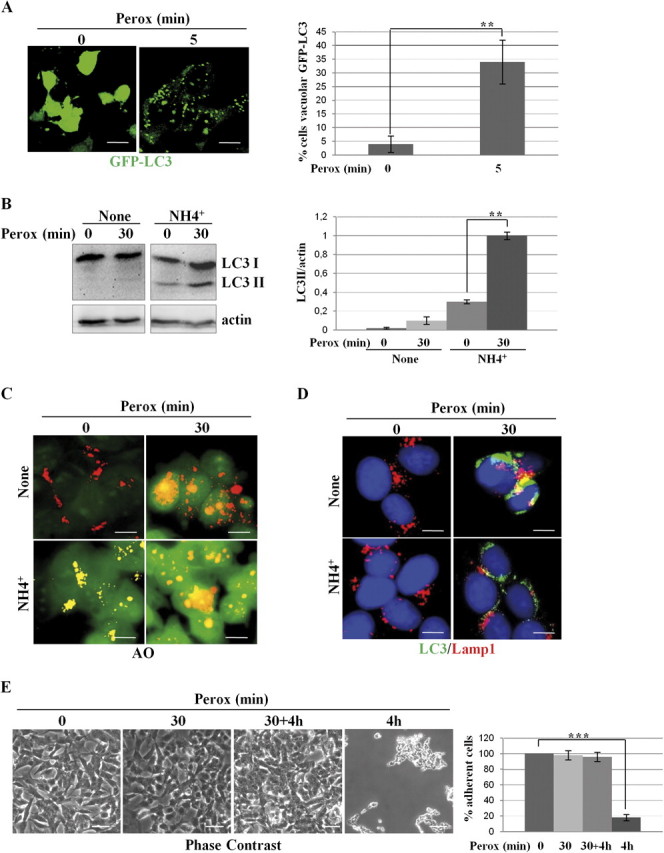
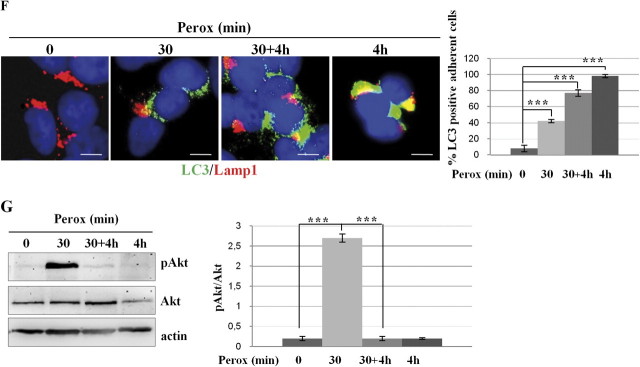
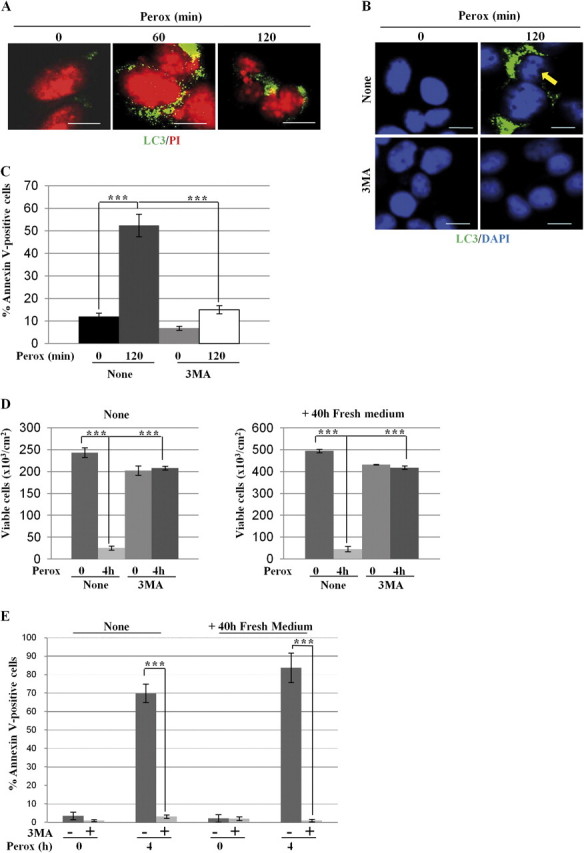
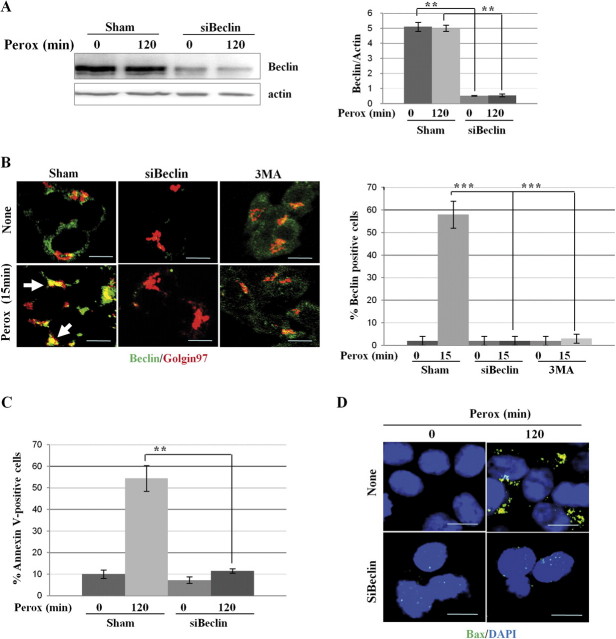
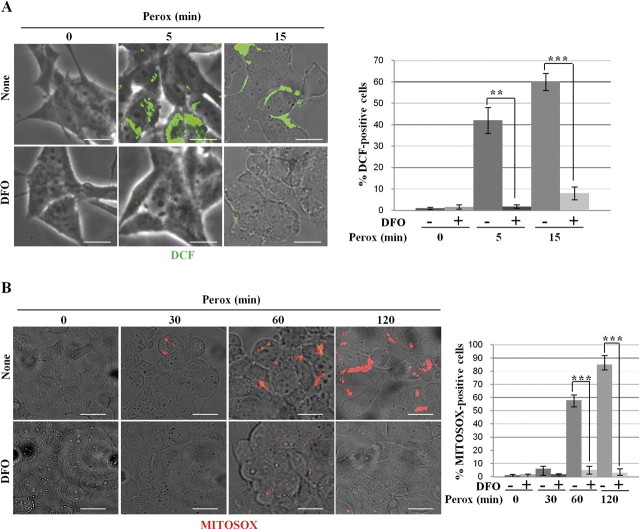
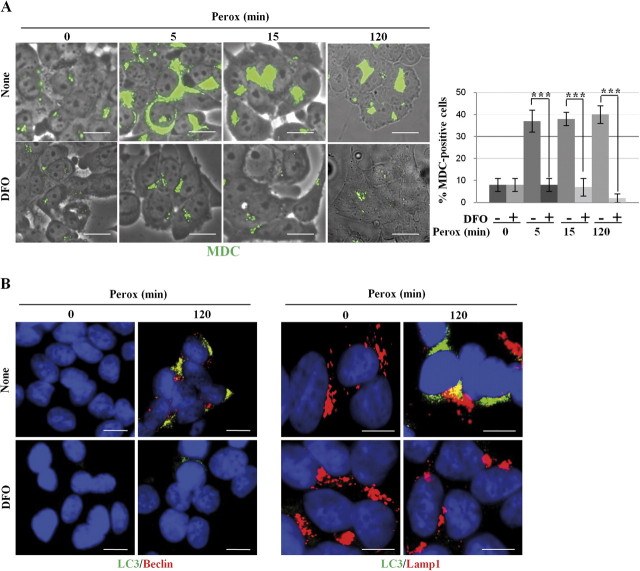
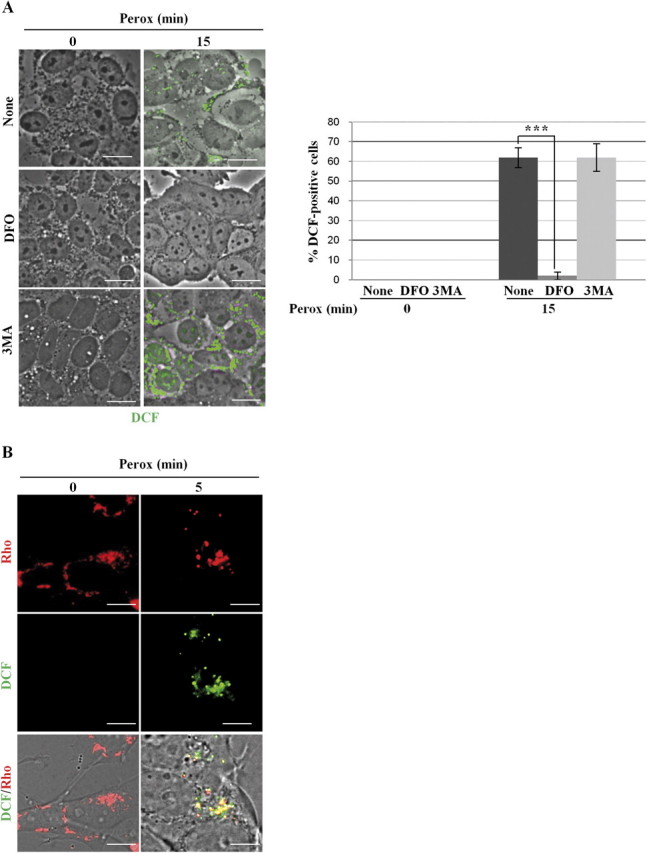
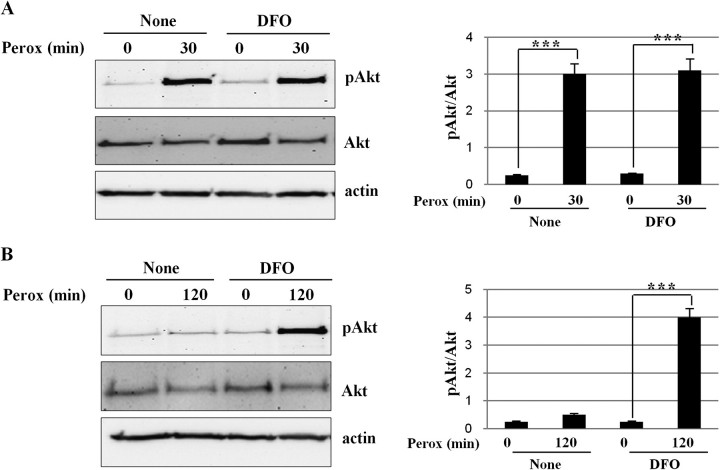
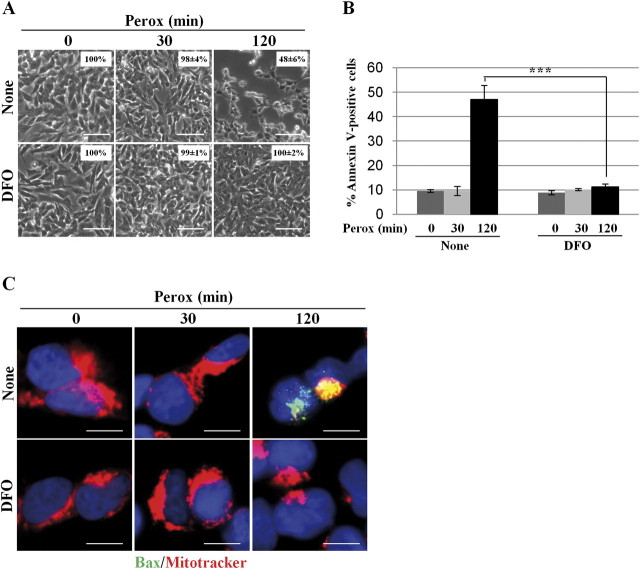
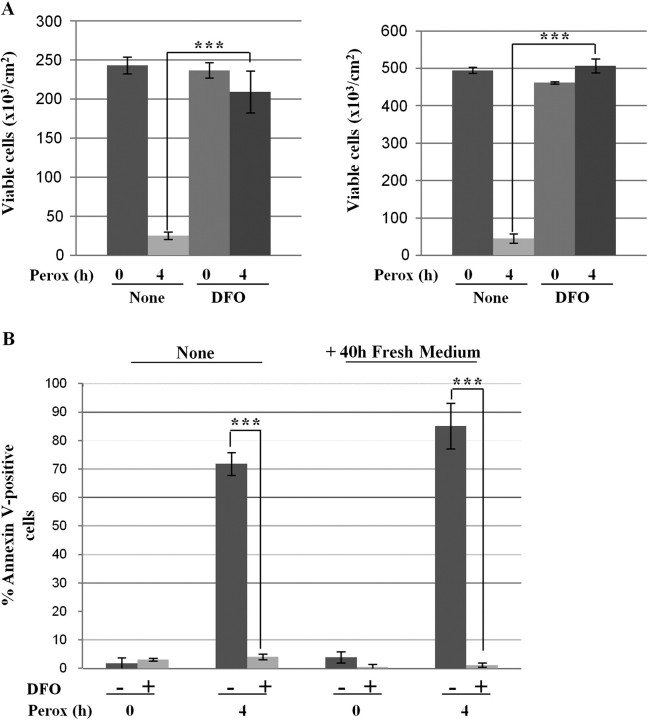
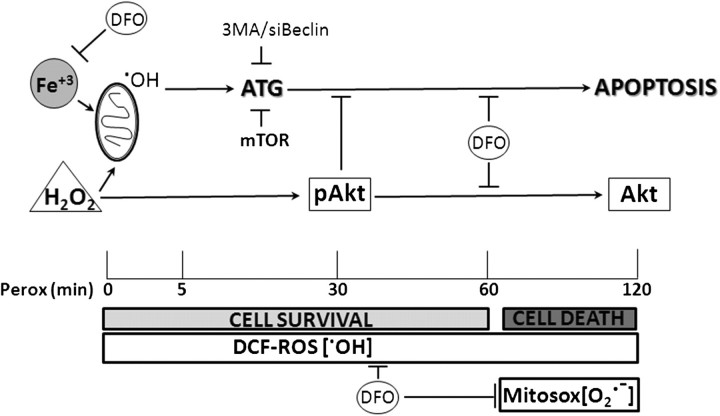
In human neuroblastoma SH-SY5Y cells, hydrogen peroxide (H(2)O(2), 200μM) rapidly (< 5 min) induced autophagy, as shown by processing and vacuolar relocation of light chain 3(LC3). Accumulation of autophagosome peaked at 30 min of H(2)O(2) exposure. The continuous presence of H(2)O(2) eventually (at > 60 min) caused autophagy-dependent annexin V-positive cell death. However, the cells exposed to H(2)O(2) for 30 min and then cultivated in fresh medium could recover and grow, despite ongoing autophagy. H(2)O(2) rapidly (5 min) triggered the formation of dichlorofluorescein-sensitive HO(·)-free radicals within mitochondria, whereas the mitochondria-associated oxidoradicals revealed by MitoSox (O(2)(·-)) became apparent after 30 min of exposure to H(2)O(2). 3-Methyladenine inhibited autophagy and cell death, but not the generation of HO(·). Genetic silencing of beclin-1 prevented bax- and annexin V-positive cell death induced by H(2)O(2), confirming the involvement of canonical autophagy in peroxide toxicity. The lysosomotropic iron chelator deferoxamine (DFO) prevented the mitochondrial generation of both HO(.) and O(2)(·-) and suppressed the induction of autophagy and of cell death by H(2)O(2). Upon exposure to H(2)O(2), Akt was intensely phosphorylated in the first 30 min, concurrently with mammalian target of rapamycin inactivation and autophagy, and it was dephosphorylated at 2 h, when > 50% of the cells were dead. DFO did not impede Akt phosphorylation, which therefore was independent of reactive oxygen species (ROS) generation but inhibited Akt dephosphorylation. In conclusion, exogenous H(2)O(2) triggers two parallel independent pathways, one leading to autophagy and autophagy-dependent apoptosis, the other to transient Akt phosphorylation, and both are inhibited by DFO. The present work establishes HO(·) as the autophagy-inducing ROS and highlights the need for free lysosomal iron for its production within mitochondria in response to hydrogen peroxide.


Figures

FIG. 1.
FIG. 1.
Inhibition of Akt sensitizes SH-SY5Y cells to H2O2 toxicity. (A) Western blotting of ser473-phosphoAkt and of total Akt in homogenates of SH-SY5Y cells exposed or not to 200μM H2O2 for the time indicated. One representative gel out of four independent experiments is shown. The filter was stripped and probed for actin as a marker of protein loading. The densitometry ratio of pAkt/total Akt is reported. (B) SH-SY5Y cells were preincubated or not with an Akt inhibitor and cultivated for up to 120 min in the absence or the presence of 200μM H2O2 (perox). At designated time-points, the adherent viable (trypan blue excluding) cells were counted. Cell density data obtained from three independent experiments in triple. (C) SH-SY5Y cells were preincubated or not with an Akt inhibitor and cultivated on sterile coverslips for 30 or 120 min in the absence or the presence of 200μM H2O2 (perox). At the end, the cells were stained with mitotracker and for immunofluorescence detection of active bax. Bax-positive/mitotracker-negative cells amounted to 15 ± 5% at 30 min and to 40 ± 15% (of the adherent cells) at 120 min in cultures exposed to H2O2 in the absence of the Akt inhibitor and to 42 ± 12% and to > 80% in the parallel cultures incubated in the presence of the Akt inhibitor. Data reproduced in three independent experiments. Bar = 10 μm.
FIG. 2.
FIG. 2.
H2O2 rapidly triggers protective autophagy in SH-SY5Y cells. (A) Transfected SH-SY5Y cells expressing the fluorescent chimeric protein GFP-LC3 were exposed or not to 200μM H2O2 (perox). The diffuse cytoplasmic fluorescence in control (Co) cells assumes a punctate pattern soon after (5 min) exposure to H2O2. Estimation of the proportion of cells presenting > 10 positive puncta/cell is reported. (B) Western blotting showing the appearance of the autophagosome marker LC3 II in cells exposed to H2O2 (perox, 30 min) in the absence or the presence of the weak base ammonium chloride (NH4Cl). The densitometry ratio of LC3 II normalized versus actin from three independent experiments is reported. (C) H2O2 increases the number and the volume of acidic vacuolar compartments stained with the acidotropic fluorochrome Acridine Orange. NH4Cl determines the alkalinization and swelling of acidic compartments in > 90% of the cell population. (D) H2O2 stimulates the formation of LC3-Lamp1 double-positive autophagolysosomes. NH4Cl largely (> 75%) prevented the fusion of LC3-positive autophagosomes with Lamp1-positive endosomes and lysosomes. (E–F) Cells incubated for 4 h in the absence of H2O2 or incubated for 30 min in the presence of H2O2 (perox) or incubated for 30 min in the presence of H2O2, then rinsed, and further incubated for 4 h in fresh medium (perox 30 min + 4 h, or incubated for 4 h in the presence of H2O2. Panels in (E) show the phase-contrast image of the monolayers, whereas panels in (F) show the immunofluorescence in cells labeled for LC3 and Lamp1. Representative images of three independent experiments are shown. Bar = 10 μm. Quantification and statistic is presented (note that at 4 h < 10% of the initial cell population was still attached on coverslip). (G) Western blotting of ser473-pAkt and of total Akt in cell homogenates of parallel cultures incubated as for the experiments described in (E). The filter was stripped and probed for actin as marker of protein loading. One representative gel out of three independent experiments is shown. The densitometry ratio of pAkt/total Akt is reported. Statistical significance between relevant treatments is indicated.
FIG. 2.
FIG. 2.
H2O2 rapidly triggers protective autophagy in SH-SY5Y cells. (A) Transfected SH-SY5Y cells expressing the fluorescent chimeric protein GFP-LC3 were exposed or not to 200μM H2O2 (perox). The diffuse cytoplasmic fluorescence in control (Co) cells assumes a punctate pattern soon after (5 min) exposure to H2O2. Estimation of the proportion of cells presenting > 10 positive puncta/cell is reported. (B) Western blotting showing the appearance of the autophagosome marker LC3 II in cells exposed to H2O2 (perox, 30 min) in the absence or the presence of the weak base ammonium chloride (NH4Cl). The densitometry ratio of LC3 II normalized versus actin from three independent experiments is reported. (C) H2O2 increases the number and the volume of acidic vacuolar compartments stained with the acidotropic fluorochrome Acridine Orange. NH4Cl determines the alkalinization and swelling of acidic compartments in > 90% of the cell population. (D) H2O2 stimulates the formation of LC3-Lamp1 double-positive autophagolysosomes. NH4Cl largely (> 75%) prevented the fusion of LC3-positive autophagosomes with Lamp1-positive endosomes and lysosomes. (E–F) Cells incubated for 4 h in the absence of H2O2 or incubated for 30 min in the presence of H2O2 (perox) or incubated for 30 min in the presence of H2O2, then rinsed, and further incubated for 4 h in fresh medium (perox 30 min + 4 h, or incubated for 4 h in the presence of H2O2. Panels in (E) show the phase-contrast image of the monolayers, whereas panels in (F) show the immunofluorescence in cells labeled for LC3 and Lamp1. Representative images of three independent experiments are shown. Bar = 10 μm. Quantification and statistic is presented (note that at 4 h < 10% of the initial cell population was still attached on coverslip). (G) Western blotting of ser473-pAkt and of total Akt in cell homogenates of parallel cultures incubated as for the experiments described in (E). The filter was stripped and probed for actin as marker of protein loading. One representative gel out of three independent experiments is shown. The densitometry ratio of pAkt/total Akt is reported. Statistical significance between relevant treatments is indicated.
FIG. 3.
FIG. 3.
Peroxide-induced autophagy is associated with inactivation of the mTOR pathway and 3MA inhibits autophagy but not transient phosphorylation of Akt. (A) Western blotting of LC3 in SH-SY5Y cells exposed to 200μM H2O2 (perox) for up to 4 h. As a positive control, the homogenate of SH-SY5Y cells exposed to 100nM rapamycin (rap) for 30 min is included. The filter was tripped and reprobed for actin. The LC3 II/actin ratio was calculated by densitometry of three independent experiments. Statistical significance between relevant treatments is indicated. (B) Western blotting of ser235/236-pS6 in SH-SY5Y cells treated as for panel (A). The filter was tripped and subsequently reprobed for total S6 and for tubulin. The pS6/S6 ratio was calculated by densitometry of three independent experiments. Statistical significance between relevant treatments is indicated. (C) Western blotting of LC3 in SH-SY5Y cells exposed to 200μM H2O2 (perox) for 2 h in the absence or the presence of 3MA. The LC3 II/actin ratio was calculated by densitometry of three independent experiments. Statistical significance between relevant treatments is indicated. (D) Western blotting of ser273-pAkt in SH-SY5Y cells exposed to 200μM H2O2 (perox) for 30 min in the absence or the presence of 3MA. The pAkt/Akt ratio was calculated by densitometry of three independent experiments. Statistical significance between relevant treatments is reported (n.s., not significant).
FIG. 4.
FIG. 4.
The Vps34 inhibitor 3-methyl adenine prevents H2O2 toxicity in SH-SY5Y cells. (A) SH-SY5Y cells plated on coverslips were exposed to 200μM H2O2 (perox) for 60 or 120 min and then fixed and processed for nuclei staining with propidium iodide (PI) and immunofluorescence detection of LC3-positive autophagosomes; 35 ± 5% of LC3-positive cells showed chromatin alteration typical of apoptotic cell death. (B) SH-SY5Y cells adherent on coverslips were preincubated or not with 3MA and exposed or not to 200μM H2O2 (perox) for 2 h. At the end, the cells were processed for nuclei staining with 4′,6-diamidino-2-phenylindole (DAPI) and immunofluorescence detection of LC3-positive autophagosomes. The arrow points to chromatin condensation and fragmentation in peroxide-treated cells. Bar = 10 μm. (C) Adherent cells preincubated or not with 3MA and exposed or not to 200μM H2O2 (perox) for 2 h. At the end, the cells were processed for cytofluorometry analysis of annexin V-FITC–labeled cells. Data (means ± SD) of four independent experiments. (D) Clonogenic assay to demonstrate the long-term protection by 3MA against peroxide stress. Two sets of cultures pretreated or not with 3MA were incubated for 4 h with or without H2O2 (perox), as indicated. At the end, the adherent viable cells of one set of cultures were counted. The cells of the other set of cultures were rinsed and cultivated for further 40 h in fresh medium and at the end the viable cells were counted. Cell density data (±SD) of two experiments in triple. (E) Cytofluorometric analysis of annexin V-FITC–positive cells of the cultures treated as above.
FIG. 5.
FIG. 5.
Genetic silencing of beclin-1 prevents H2O2 toxicity in SH-SY5Y cells. (A) Western blotting showing the knock down (> 90%) of beclin-1 elicited by the specific siRNA (siBeclin). The filter was stripped and probed for actin as marker of protein loading. Similar results were obtained in two other experiments. Statistic of densitometry is reported. (B) Sham- and beclin-1–specific siRNA-transfected (siBeclin) cells adherent on coverslips were exposed or not to H2O2 for 15 min and then fixed and fluorescently double stained for beclin-1 and Golgin-97. Images (representative of three separate experiments) show that H2O2 induces the rapid polarization of beclin-1–positive aggregates in a Golgin-97–positive area. The experiment also confirms the efficient silencing of beclin-1 expression attained by the specific siRNA. Quantification of beclin aggregates–positive cells is indicated. (C) The extent of apoptotic cell death was assayed by flow cytometry analysis of annexin V-FITC positivity in sham- and beclin-1–specific siRNA-transfected cells exposed for 2 h to H2O2. Data from three independent experiments demonstrate that posttranscriptional silencing of beclin-1 protects the cells from H2O2 toxicity. Statistical significance between relevant treatments is indicated. (D) Fluorescence staining of bax and DAPI in sham- and beclin-1–specific siRNA-transfected (siBeclin) cells exposed or not to H2O2 for 120 min. Images (representative of three separate experiments) show that H2O2 induces bax activation and oligomerization in sham-transfected (∼50% of the population remained attached) not in siBeclin-transfected cells. Bar = 10 μm.
FIG. 6.
FIG. 6.
Effect of DFO on the oxidation of H2DCF and MitoSox by H2O2 in SH-SY5Y cultures. Cells adherent on coverslips and preincubated with or without DFO as indicated were exposed for 0, 5, and 15 min to H2O2. Cells were preloaded with the hydroxyl-sensitive fluorescent probe H2DCF-DA. DCF oxidation was soon detected as fluorescent spots in cultures exposed to H2O2, but not if they had been preincubated with DFO. Quantification of DCF-positive cells is reported. (B) Cells adherent on coverslips and preincubated with or without DFO as indicated were exposed for up to 120 min to H2O2. Cells were preloaded with the superoxide anion-sensitive MitoSox fluorescent probe. In H2O2-treated cultures, MitoSox oxidation was faintly detectable at 60 min and more intensely detected at 120 min and was completely prevented by DFO. Quantification of MitoSox-positive cells is reported (consider that at 120 min > 50% of the cells detached). Images are representative of four independent experiments. Bar = 10 μm.
FIG. 7.
FIG. 7.
DFO abrogates induction of autophagy by H2O2. (A) SH-SY5Y cells plated on coverslips were preincubated or not with DFO and exposed to H2O2 for the time indicated. The induction of autophagy was assessed with the fluorescent probe MDC, which mirrors the presence of acidic autophagolysosomes. Quantification of MDC-positive cells is reported (consider that at 120 min > 50% of the cells detached). (B) SH-SY5Y cells plated on coverslips were preincubated or not with DFO and exposed to H2O2 for 2 h, then fixed, and processed for immunofluorescence detection of the autophagy markers beclin-1 and LC3 and of the endosomal-lysosomal marker Lamp1. The images in panels (A) and (B) are representative of four independent experiments and document that DFO prevented the induction of autophagy by H2O2. Bar = 10 μm.
FIG. 8.
FIG. 8.
DFO, not 3-methyl adenine, prevents the mitochondrial generation of hydroxyl radicals. (A) SH-SY5Y cells cultivated on coverslips were preincubated or not with 3MA or DFO, exposed to 200μM H2O2 (perox) for 15 min, and then processed for detection of ROS with the H2DCF-DA probe. DCF-positive puncta are observed in peroxide-treated cells. DFO, not 3MA, could prevent DCF oxidation by H2O2. Quantification and statistical analysis of DCF-positive cells is reported. (B) SH-SY5Y cells cultivated on coverslips were preloaded with the H2DCF-DA probe, exposed to 200μM H2O2 (perox) for 5 min, labeled with Rhodamine 123 (Rho), and immediately observed under the fluorescence microscope. In peroxide-treated cells, DCF-positive and Rhodamine-positive puncta largely (> 85% puncta) colocalize. Images shown in these figure are representative of five independent experiments. Bar = 10 μm.
FIG. 9.
FIG. 9.
Effect of DFO on the phosphorylation/dephosphorylation of Akt induced by H2O2. SH-SY5Y cells preincubated or not with DFO and exposed to H2O2 for the time indicated. At the end of the incubation, the cells were collected and homogenized in lysis buffer for western blotting analysis. The filter was subsequently probed, stripped, and reprobed for ser473-phosphorylated Akt, total Akt, and actin. Akt is up-phosphorylated within 30 min (A) and phosphorylation decays by 120 min of exposure to H2O2 (B), but it is maintained in cells that had been preincubated with DFO. These experiments have been performed three times with reproducible results (one representative western blotting is shown). The densitometry of the bands (pAkt/Akt ratio) and statistical significance between relevant treatments is reported.
FIG. 10.
FIG. 10.
DFO inhibits bax-mediated cell death induced by H2O2. (A) SH-SY5Y cells were preincubated or not with DFO and exposed to 200μM H2O2 (perox) for 30 and 120 min. The monolayer was photographed under a phase-contrast microscope to document cell loss. The images show that DFO could prevent cell loss induced by H2O2 at 2 h. (The percentage of adherent cells is reported in the inset.) (B) SH-SY5Y cells were preincubated or not with DFO and exposed to 200μM H2O2 (perox) for 30 and 120 min. The cells were then processed for annexin V-FITC labeling and analyzed by cytofluorometry. Data represent the mean ± SD of three independent experiments in triplicate. Statistical significance between relevant treatments is reported. (C) SH-SY5Y cells adherent on coverslips and preincubated or not with DFO were incubated with 200μM H2O2 (perox) for 30 and 120 min. Cells were then processed for mitotracker and immunofluorescence staining of activated bax. At 2 h of incubation, H2O2 provoked (in about 50% of the cells) the formation of bax macroaggregates and concomitant loss of mitotracker labeling, suggestive of activation of the intrinsic death pathway. This effect was completely abolished by DFO. Images shown in this figure are representative of three independent experiments. Bar = 10 μm.
FIG. 11.
FIG. 11.
DFO protection against oxidative stress persists for long time. Clonogenic assay to demonstrate the long-term protection by DFO against peroxide stress. Two sets of cultures pretreated or not with DFO were incubated for 4 h with or without H2O2 (perox), as indicated. (A) At the end, the adherent viable cells of one set of cultures were counted. The cells of the other set of cultures were rinsed and cultivated for further 40 h in fresh medium, and at the end the viable cells were counted. Cell density data (±SD) of two experiments in triple (note that controls are the same as in Fig. 3D). (B) Cytofluorometric analysis of annexin V-FITC–positive cells of the cultures treated as above. Statistical significance between relevant treatments is reported.
FIG. 12.
FIG. 12.
Schematic representation of the results. H2O2 triggers two parallel and independent pathways, one leading to induction of autophagy, the other to transient Akt phosphorylation. Induction of autophagy depends on the mitochondrial generation of hydroxyl radicals, which arise from Fenton reaction between H2O2 and redox-active iron. The mTOR pathway is inactive in oxidative-stressed cells. Akt phosphorylation does not preclude autophagy but prevents apoptosis in H2O2-stressed cells. However, prolonged incubation in the presence of H2O2 leads to Akt dephosphorylation and autophagy-dependent cell death. DFO, by sequestering iron within lysosomes, prevents the prompt formation of hydroxyl radicals (as well as of superoxide anion, which appears later) and, consequently, of autophagy and apoptosis induced by H2O2. DFO also prevents Akt dephosphorylation. 3MA and siRNA-beclin-1 prevents autophagy and cell death.

Similar articles

Cited by

  • Mild MPP+ exposure-induced glucose starvation enhances autophagosome synthesis and impairs its degradation.
    Sakamoto S, Miyara M, Sanoh S, Ohta S, Kotake Y. Sakamoto S, et al. Sci Rep. 2017 Apr 26;7:46668. doi: 10.1038/srep46668. Sci Rep. 2017. PMID: 28443637 Free PMC article.
  • Overexpression of parkin rescues the defective mitochondrial phenotype and the increased apoptosis of Cockayne Syndrome A cells.
    Pascucci B, D'Errico M, Romagnoli A, De Nuccio C, Savino M, Pietraforte D, Lanzafame M, Calcagnile AS, Fortini P, Baccarini S, Orioli D, Degan P, Visentin S, Stefanini M, Isidoro C, Fimia GM, Dogliotti E. Pascucci B, et al. Oncotarget. 2016 Jun 7;8(61):102852-102867. doi: 10.18632/oncotarget.9913. eCollection 2017 Nov 28. Oncotarget. 2016. PMID: 29262528 Free PMC article.
  • Guidelines for the use and interpretation of assays for monitoring autophagy (4th edition)1.
    Klionsky DJ, Abdel-Aziz AK, Abdelfatah S, Abdellatif M, Abdoli A, Abel S, Abeliovich H, Abildgaard MH, Abudu YP, Acevedo-Arozena A, Adamopoulos IE, Adeli K, Adolph TE, Adornetto A, Aflaki E, Agam G, Agarwal A, Aggarwal BB, Agnello M, Agostinis P, Agrewala JN, Agrotis A, Aguilar PV, Ahmad ST, Ahmed ZM, Ahumada-Castro U, Aits S, Aizawa S, Akkoc Y, Akoumianaki T, Akpinar HA, Al-Abd AM, Al-Akra L, Al-Gharaibeh A, Alaoui-Jamali MA, Alberti S, Alcocer-Gómez E, Alessandri C, Ali M, Alim Al-Bari MA, Aliwaini S, Alizadeh J, Almacellas E, Almasan A, Alonso A, Alonso GD, Altan-Bonnet N, Altieri DC, Álvarez ÉMC, Alves S, Alves da Costa C, Alzaharna MM, Amadio M, Amantini C, Amaral C, Ambrosio S, Amer AO, Ammanathan V, An Z, Andersen SU, Andrabi SA, Andrade-Silva M, Andres AM, Angelini S, Ann D, Anozie UC, Ansari MY, Antas P, Antebi A, Antón Z, Anwar T, Apetoh L, Apostolova N, Araki T, Araki Y, Arasaki K, Araújo WL, Araya J, Arden C, Arévalo MA, Arguelles S, Arias E, Arikkath J, Arimoto H, Ariosa AR, Armstrong-James D, Arnauné-Pelloquin L, Aroca A, Arroyo DS, Arsov I, Artero R, Asaro DML, Aschner M, Ashrafizadeh M, Ashur-Fabian O, Atanasov AG, Au AK, Auberger P, Auner HW, Aurelian L, Autelli R… See abstract for full author list ➔ Klionsky DJ, et al. Autophagy. 2021 Jan;17(1):1-382. doi: 10.1080/15548627.2020.1797280. Epub 2021 Feb 8. Autophagy. 2021. PMID: 33634751 Free PMC article.
  • Deferiprone protects against photoreceptor degeneration by inhibiting parthanatos.
    Villarejo-Zori B, Zapata-Muñoz J, Sierra-Filardi E, Ramírez-Pardo I, Montava-Garriga L, Ganley IG, Boya P. Villarejo-Zori B, et al. Cell Death Dis. 2025 May 19;16(1):402. doi: 10.1038/s41419-025-07686-x. Cell Death Dis. 2025. PMID: 40389413 Free PMC article.
  • Epigenetic control of autophagy by microRNAs in ovarian cancer.
    Titone R, Morani F, Follo C, Vidoni C, Mezzanzanica D, Isidoro C. Titone R, et al. Biomed Res Int. 2014;2014:343542. doi: 10.1155/2014/343542. Epub 2014 Apr 30. Biomed Res Int. 2014. PMID: 24877083 Free PMC article.

References

    1. Alexander A, Cai SL, Kim J, Nanez A, Sahin M, MacLean KH, Inoki K, Guan KL, Shen J, Person MD, et al. ATM signals to TSC2 in the cytoplasm to regulate mTORC1 in response to ROS. Proc. Natl. Acad. Sci. U.S.A. 2010;107:4153–4158. - PMC - PubMed
    1. Antico Arciuch VG, Galli S, Franco MC, Lam PY, Cadenas E, Carreras MC, Poderoso JJ. Akt1 intramitochondrial cycling is a crucial step in the redox modulation of cell cycle progression. PLoS One. 2009;4:e7523. - PMC - PubMed
    1. Arico S, Petiot A, Bauvy C, Dubbelhuis PF, Meijer AJ, Codogno P, Ogier-Denis E. The tumor suppressor PTEN positively regulates macroautophagy by inhibiting the phosphatidylinositol 3-kinase/protein kinase B pathway. J. Biol. Chem. 2001;276:35243–35246. - PubMed
    1. Arsham AM, Neufeld TP. Thinking globally and acting locally with TOR. Curr. Opin. Cell. Biol. 2006;18:589–597. - PubMed
    1. Bilski P, Belanger AG, Chignell CF. Photosensitized oxidation of 2′,7′-dichlorofluorescin: Singlet oxygen does not contribute to the formation of fluorescent oxidation product 2′,7′-dichlorofluorescein. Free Radic. Biol. Med. 2002;33:938–946. - PubMed

Publication types

MeSH terms