. 2011 Oct;10(10):M111.008862.
doi: 10.1074/mcp.M111.008862. Epub 2011 Jul 8.

Modeling of pathological traits in Alzheimer's disease based on systemic extracellular signaling proteome

Affiliations

Modeling of pathological traits in Alzheimer's disease based on systemic extracellular signaling proteome

Markus Britschgi et al. Mol Cell Proteomics. 2011 Oct.

Abstract

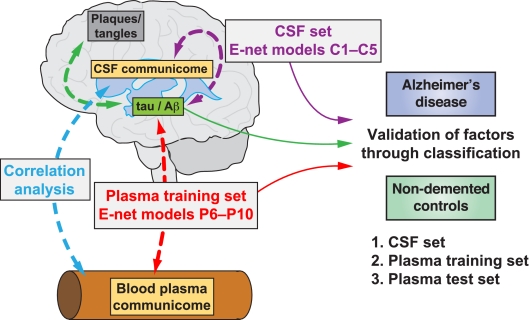
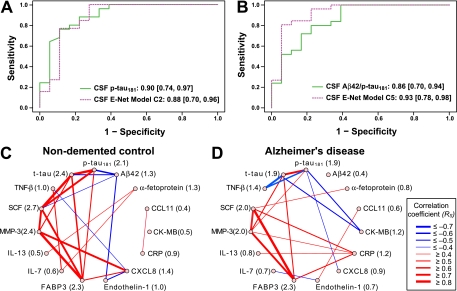
The study of chronic brain diseases including Alzheimer's disease in patients is typically limited to brain imaging or psychometric testing. Given the epidemic rise and insufficient knowledge about pathological pathways in sporadic Alzheimer's disease, new tools are required to identify the molecular changes underlying this disease. We hypothesize that levels of specific secreted cellular signaling proteins in cerebrospinal fluid or plasma correlate with pathological changes in the Alzheimer's disease brain and can thus be used to discover signaling pathways altered in the disease. Here we measured 91 proteins of this subset of the cellular communication proteome in plasma or cerebrospinal fluid in patients with Alzheimer's disease and cognitively normal controls to mathematically model disease-specific molecular traits. We found small numbers of signaling proteins that were able to model key pathological markers of Alzheimer's disease, including levels of cerebrospinal fluid β-amyloid and tau, and classify disease in independent samples. Several of these factors had previously been implicated in Alzheimer's disease supporting the validity of our approach. Our study also points to proteins which were previously unknown to be associated with Alzheimer's disease thereby implicating novel signaling pathways in this disorder.


Conflict of interest statement

CONFLICT OF INTEREST: The authors do not report a conflict of interest.

Figures

Fig. 1.
Fig. 1.
Modeling of pathological markers in CSF and classification of AD based on communication factors in CSF and plasma. Accumulation of plaques and tangles in the AD brain is associated with decreased levels of Aβ and increased levels of tau in CSF, respectively (green dashed double arrow). Relative levels of these proteins alone or their ratios can be used to classify AD and NDC (green solid arrow). In Elastic net (E-net) regression models C1–C5 soluble communication factors in CSF (CSF communicome; see text for details) are used to model tau and Aβ levels or their ratios (dashed purple double arrow) and subsequently to classify AD and NDC (solid purple line). In E-net models P6-P10 soluble communication factors in plasma (plasma communicome) derived from the training set are used to model tau and Aβ levels or their ratios (dashed red double arrow) and subsequently to classify AD and NDC (solid red line). These variables were validated by classifying AD and NDC in an independent test set. In a separate analysis correlations are studied between CSF communicome proteins and corresponding plasma communicome proteins in AD patients and NDCs (dashed blue double arrow).
Fig. 2.
Fig. 2.
Pathology associated CSF communicome models can classify AD and NDC and the connectivity network of the proteins in these models is altered in AD patients. A, B, CSF pathological markers or CSF Elastic net (E-net) models C2 and C5 were used to calculate ROC curves. The color-coding is based on Fig. 1 and the numbers indicate the AUC values and 95% C.I. (listed also in Table II). A, CSF samples from AD patients and NDC were classified based on levels of CSF p-tau181 (solid green line) or levels of CSF communicome proteins (FABP3, CCL11, endothelin-1, CK-MB, IL-13, CXCL8) and APOE4 status selected in model C2 (dashed purple line). B, CSF samples from AD patients and NDC were classified based on levels of CSF Aβ42/p-tau181 (solid green line) or levels of CSF communicome proteins (FABP3, IL-13, SCF, CK-MB, α-fetoprotein, endothelin-1, CRP) and APOE4 status selected in model C5 (dashed purple line). C, D, Network diagrams illustrating connectivity between CSF pathological markers and CSF communication factors selected in models C1–C5. The connectivity between two proteins is expressed as Spearman rank correlation coefficient RS calculated from all measurements for these two proteins in CSF samples of nondemented controls (C) or AD patients (D), respectively. The correlations are visualized in a network with different strokes and colors depending on strength and type of connectivity among proteins. Red strokes RS ≥ 0.4, blue strokes RS ≤ –0.4. In parentheses next to the name of the analyte is the interaction score, which is the sum of the squared values of all RS among all analytes in the connectivity diagram. Note the considerable change of the interaction scores between communication factors in AD patients (D) compared with NDC (C).
Fig. 3.
Fig. 3.
Pathology associated plasma communicome models that efficiently classify AD and NDC are validated in an independent test set. ROC curves for the plasma training and a test set were calculated with CSF pathological markers (solid green lines), AD risk factors APOE4 status and age (solid black lines), or plasma Elastic net (E-net) models P2 and P5 (dashed red lines), respectively. The color-coding is based on Fig. 1 and the numbers indicate the AUC values and 95% C.I. (listed also in Table II). A, AD patients and NDC in the training set were classified based on levels of CSF p-tau181 or the variables selected to be associated with p-tau181 in e-net model P2: plasma communicome proteins (MCSF, CD40L, G-CSF, adiponectin, CCL2, CK-MB, TNF-β, β2-microglobulin, TNF RII, IL-4, IL-3, IL-18, PAI-1, Apo CIII, TBG), APOE4 status, and age. B, The variables selected in the training set E-net model P2 are validated in an independent test set of AD and NDC and compared with the ROC curves that were calculated based either on levels of CSF p-tau181 or APOE4 status and age of 53 of the 65 subjects in the test set; measurements of Aβ42 and tau were not done for six NDC and six AD in the test set. C, AD patients and NDC in the training set were classified based on levels of CSF Aβ42/p-tau181 or the variables selected to be associated with p-tau181 in E-net model P10: plasma communicome proteins (MCSF, G-CSF, GH, TPO), APOE4 status, and age. D, The variables selected in the training set E-net model P10 are validated in an independent test set of AD and NDC and compared with the ROC curves that were calculated based either on levels of CSF Aβ42/p-tau181 or APOE4 status and age of the subjects in the test set. See connectivity network in Fig. 4 for illustration of the changes in interactions among communication factors in AD patients compared with controls.
Fig. 4.
Fig. 4.
Plasma predictors of pathological markers point to changes in the communicome network in plasma of AD patients. A, B, Connectivity diagrams of pathological markers in CSF and communication factors in plasma, which were chosen in Elastic net regression models for these markers. The relationship between two proteins is expressed as Spearman rank correlation coefficient RS calculated from all measurements for these two proteins in nondemented controls (A) or AD patients (B), respectively. The correlations are visualized in a network with different strokes and colors depending on strength and type of a relationship among proteins. Red strokes RS ≥ 0.4, blue strokes RS ≤ −0.4. In parentheses next to the name of the analyte is the interaction score, which is the sum of the squared values of all RS among all analytes in the connectivity diagram. Note the considerable difference in connectivity among communication factors in AD patients compared with NDC.
Fig. 5.
Fig. 5.
Correlations and connectivity between communication factors in CSF and plasma are different in AD patients compared with NDC. A, Spearman rank correlations (correlation coefficient RS) between CSF and plasma in nondemented controls (green bars) and AD patients (blue bars). Proteins with RS ≥ 0.5 in at least one group are shown. RS ≤ –0.5 were not observed. Note that levels of CCL5 and ICAM-1 correlate much stronger in AD than in NDC across the BBB and that ApoH and CCL2 reach RS = 0.5 in AD but not in NDC. B, C, Connectivity diagrams illustrating correlations between CSF communication factors selected in models C1–C5 and plasma communication factors selected in models P6–P10. In parentheses are the interaction scores. See legend to Fig. 2 for more details on calculations. Note the considerable lack and difference in connectivity between communication factors in AD patients (C) compared with NDC (B). See also supplemental Fig. S1. BBB, blood-brain barrier.

Similar articles

Cited by

  • Expanding the Repertoire of Biomarkers for Alzheimer's Disease: Targeted and Non-targeted Approaches.
    Galasko D. Galasko D. Front Neurol. 2015 Dec 16;6:256. doi: 10.3389/fneur.2015.00256. eCollection 2015. Front Neurol. 2015. PMID: 26733934 Free PMC article. Review.
  • Astrocytes as a Therapeutic Target in Alzheimer's Disease-Comprehensive Review and Recent Developments.
    Rodríguez-Giraldo M, González-Reyes RE, Ramírez-Guerrero S, Bonilla-Trilleras CE, Guardo-Maya S, Nava-Mesa MO. Rodríguez-Giraldo M, et al. Int J Mol Sci. 2022 Nov 7;23(21):13630. doi: 10.3390/ijms232113630. Int J Mol Sci. 2022. PMID: 36362415 Free PMC article. Review.
  • Neuroinflammation in Alzheimer's disease.
    Heneka MT, Carson MJ, El Khoury J, Landreth GE, Brosseron F, Feinstein DL, Jacobs AH, Wyss-Coray T, Vitorica J, Ransohoff RM, Herrup K, Frautschy SA, Finsen B, Brown GC, Verkhratsky A, Yamanaka K, Koistinaho J, Latz E, Halle A, Petzold GC, Town T, Morgan D, Shinohara ML, Perry VH, Holmes C, Bazan NG, Brooks DJ, Hunot S, Joseph B, Deigendesch N, Garaschuk O, Boddeke E, Dinarello CA, Breitner JC, Cole GM, Golenbock DT, Kummer MP. Heneka MT, et al. Lancet Neurol. 2015 Apr;14(4):388-405. doi: 10.1016/S1474-4422(15)70016-5. Lancet Neurol. 2015. PMID: 25792098 Free PMC article. Review.
  • Plasma proteomics for the identification of Alzheimer disease.
    Guo LH, Alexopoulos P, Wagenpfeil S, Kurz A, Perneczky R; Alzheimer’s Disease Neuroimaging Initiative. Guo LH, et al. Alzheimer Dis Assoc Disord. 2013 Oct-Dec;27(4):337-42. doi: 10.1097/WAD.0b013e31827b60d2. Alzheimer Dis Assoc Disord. 2013. PMID: 23314060 Free PMC article. Clinical Trial.
  • The immunology of neurodegeneration.
    Czirr E, Wyss-Coray T. Czirr E, et al. J Clin Invest. 2012 Apr;122(4):1156-63. doi: 10.1172/JCI58656. Epub 2012 Apr 2. J Clin Invest. 2012. PMID: 22466657 Free PMC article. Review.

References

    1. Steinman L. (2008) Nuanced roles of cytokines in three major human brain disorders. J. Clin. Invest. 118, 3557–3563 - PMC - PubMed
    1. Perry V. H., Cunningham C., Holmes C. (2007) Systemic infections and inflammation affect chronic neurodegeneration. Nat. Rev. Immunol. 7, 161–167 - PubMed
    1. Alzheimer's Association National Office (2011) 2011 Alzheimer's Disease Facts and Figures. Alzheimer's Association National Office, IL - PubMed
    1. Dubois B., Feldman H. H., Jacova C., Cummings J. L., Dekosky S. T., Barberger-Gateau P., Delacourte A., Frisoni G., Fox N. C., Galasko D., Gauthier S., Hampel H., Jicha G. A., Meguro K., O'Brien J., Pasquier F., Robert P., Rossor M., Salloway S., Sarazin M., de Souza L. C., Stern Y., Visser P. J., Scheltens P. (2010) Revising the definition of Alzheimer's disease: a new lexicon. Lancet Neurol. 9, 1118–1127 - PubMed
    1. Dubois B., Feldman H. H., Jacova C., Dekosky S. T., Barberger-Gateau P., Cummings J., Delacourte A., Galasko D., Gauthier S., Jicha G., Meguro K., O'brien J., Pasquier F., Robert P., Rossor M., Salloway S., Stern Y., Visser P. J., Scheltens P. (2007) Research criteria for the diagnosis of Alzheimer's disease: revising the NINCDS-ADRDA criteria. Lancet Neurol. 6, 734–746 - PubMed

Publication types

MeSH terms