. 2011 Jul 10;13(8):958-65.
doi: 10.1038/ncb2286.

Mir193b-365 is essential for brown fat differentiation

Affiliations

Mir193b-365 is essential for brown fat differentiation

Lei Sun et al. Nat Cell Biol. .

Abstract

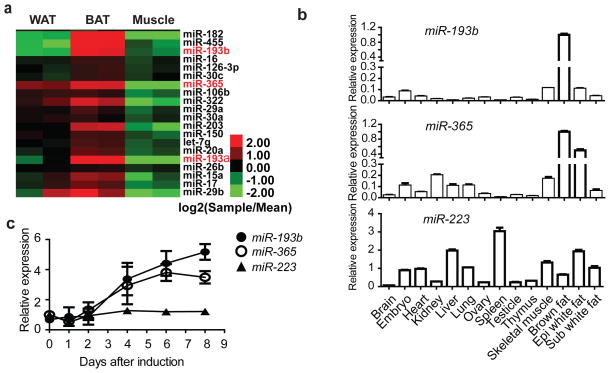
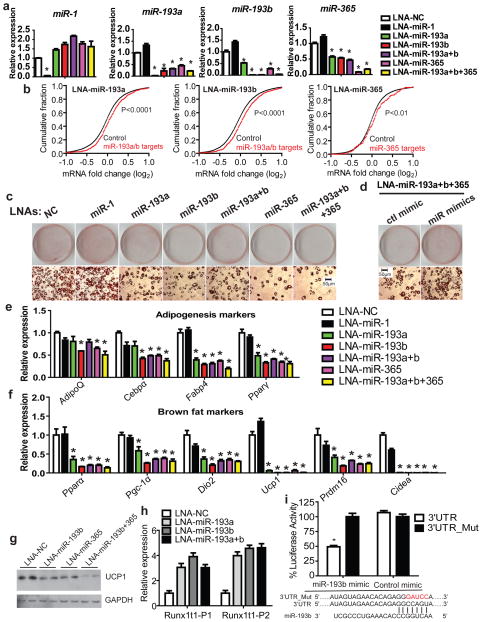
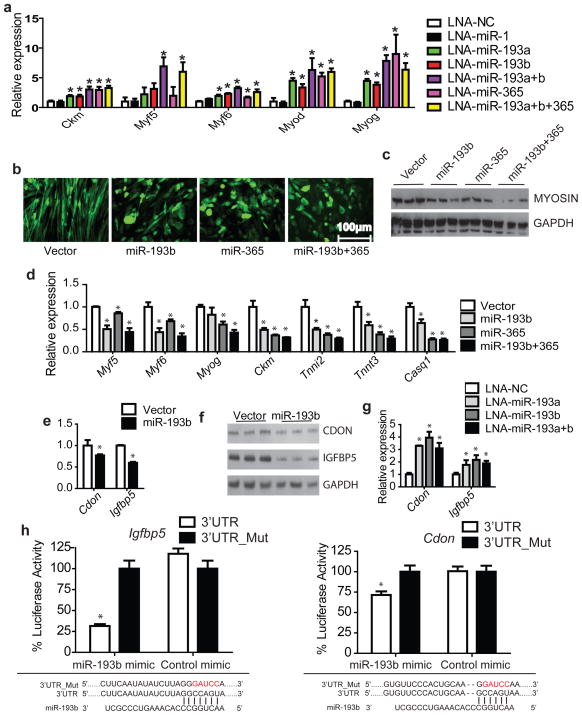
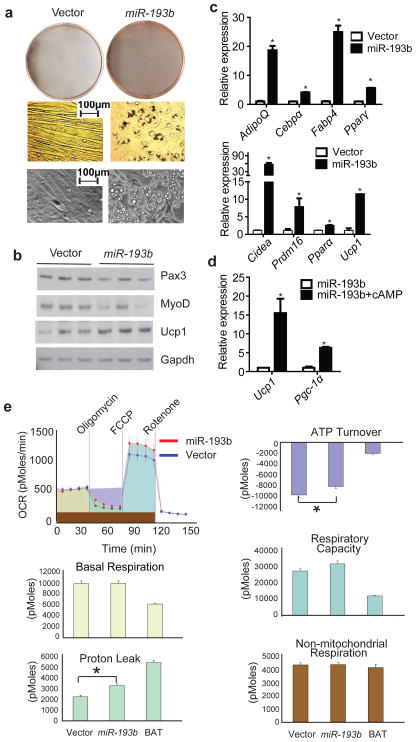
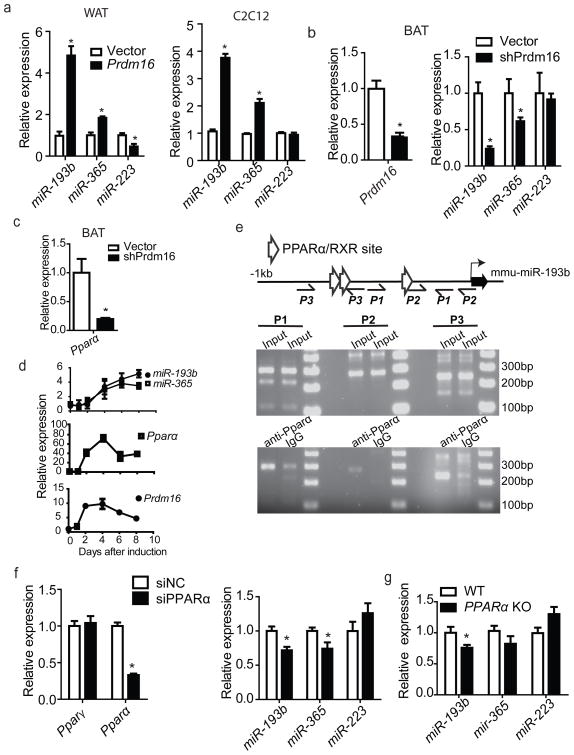
Mammals have two principal types of fat. White adipose tissue primarily serves to store extra energy as triglycerides, whereas brown adipose tissue is specialized to burn lipids for heat generation and energy expenditure as a defence against cold and obesity. Recent studies have demonstrated that brown adipocytes arise in vivo from a Myf5-positive, myoblastic progenitor by the action of Prdm16 (PR domain containing 16). Here, we identified a brown-fat-enriched miRNA cluster, MiR-193b-365, as a key regulator of brown fat development. Blocking miR-193b and/or miR-365 in primary brown preadipocytes markedly impaired brown adipocyte adipogenesis by enhancing Runx1t1 (runt-related transcription factor 1; translocated to, 1) expression, whereas myogenic markers were significantly induced. Forced expression of Mir193b and/or Mir365 in C2C12 myoblasts blocked the entire programme of myogenesis, and, in adipogenic conditions, miR-193b induced myoblasts to differentiate into brown adipocytes. Mir193b-365 was upregulated by Prdm16 partially through Pparα. Our results demonstrate that Mir193b-365 serves as an essential regulator for brown fat differentiation, in part by repressing myogenesis.


Conflict of interest statement

COMPETING GINANCIAL INTERESTS

The authors declare no financial conflict of interest.

Figures

Figure 1
Figure 1. miR-193b-365 is enriched in BAT
(a), Heat map showing the expression of miRNAs that are enriched in BAT compared to epididymal WAT and skeletal muscle. Red denotes higher and green denotes lower relative to the mean of the six samples for each miRNA. (P < 0.1, ANOVA). (b), Real-time PCR analysis of miR-193b, miR-365, and a control miRNA, miR-223 expression levels in BAT relative to other adult mouse tissues. n=3. (c), Real-time PCR analysis of miR-193b and miR-365 expression levels during adipogenesis of primary brown adipocyte cultures. n=3. Means ± SEM.
Figure 2
Figure 2. miR-193b-365 is required for brown adipocyte adipogenesis
(a), SVF cells from brown fat were transfected with LNA miRNA inhibitors (100nM) one day before differentiation. RNAs were harvested at day 4. Real-time PCR was used to examine the expression of these miRNAs. n=3. (b), mRNAs from cultured primary brown adipocytes (Day 4) transfected with each inhibitor or Control inhibitor were analyzed by microarray analysis. On the x-axis is the relative expression of each gene calculated as a log2 ratio (x-axis) between its intensity in the miRNA-inhibited sample and its intensity in the control inhibitor sample. The cumulative fraction (y-axis) was plotted as a function of the relative expression (x-axis). “miRNA targets” (red line) represents the population of genes containing miRNA binding sites predicted by TargetScan, and “Control” (black line) represented all other genes lacking binding sites for the miRNA. The “targets” curve shifts to the right with a P value <0.05 as determined by the one-sided Kolmogorov-Smirnov test, indicating a trend of up-regulation of predicted targets in response to transfection of the miRNA inhibitor. (c), Oil red O staining was used to determine the accumulation of lipid droplets in brown adipocytes (Day 4). (d), SVF cells from brown fat were co-transfected with LNA miRNA inhibitors (100nM) and miRNA mimics (mimic-miR-193a 16.7nM, mimic-miR-193b 16.7nM and mimic-miR-365 16.7nM, or Control mimic 50nM) one day before differentiation. Four days after differentiation, ORO staining was used to determine lipid droplet content. (e), Real-time PCR analysis of the expression of adipogenesis markers and (f), Brown fat markers. n=3. (g), Western blot to examine the expression of Ucp1. (h), Effect of miR-193 knockdown on expression of Runx1t1. Real-time PCR was performed to examine the expression of Runx1t1. Runx1t1-P1 and Runx1t1-P2 represent two sets of PCR primers. n=3. (i), Luciferase reporter assay to examine the interactions between miR-193b and the predicted target site in Runx1t1 3′UTR. Plasmids with the Runx1t1 3′UTRs or mutated UTRs were co-transfected with miR-193b mimic or a control mimic into 293T cells. Renilla luciferase activity was measured by Dual-Glo luciferase assay system and normalized to internal control firefly luciferase activity. n=6. * P < 0.05, Student’s t-test; Means ± SEM.
Figure 3
Figure 3. Ectopic expression of miR-193b and/or miR-365 inhibits C2C12 myogenic differentiation
(a), SVF cells from brown fat were transfected with LNA miRNA inhibitors (100nM) one day before differentiation. At day 4, RNAs were extracted and Real-time PCR was performed to detect the expression of myogenic markers. n=3. (b), Representative micrographs of cells (Day 6 in 2% horse serum) differentiated from C2C12 myoblasts expressing retroviral miR-193b and/or miR-365, or control. GFP was expressed under control of an IRES downstream of the miRNA to visualize transfected cells. (c), Western blot with triplicate biological repeats to examine the expression of myosin upon ectopic expression of miR-193b and/or miR-365. (d), Real-time PCR analysis for expression of muscle markers. n=3. (e), Real-time PCR and (f), Western analysis for predicted miR-193b targets, cell adhesion molecule-related/down-regulated by oncogenes (Cdon) and insulin-like growth factor binding protein 5 (Igfbp5), in C2C12 cells expressing miR-193b or a control vector. n=3. (g), SVF cells from brown fat were transfected with LNA-miR-193a and/or LNA-miR-193b, and differentiated for 4 days. Real-time PCR was performed to examine the expression of Cdon and Igfbp5. n=6. (h), Luciferase reporter assay to examine the interactions between miR-193b and the predicted target site in Cdon and Igfbp5 3′UTR. Plasmids with the Igfbp5 or Cdon 3′UTRs or mutated UTRs were co-transfected with miR-193b mimic or a control mimic into 293T cells. Renilla luciferase activity was measured by Dual-Glo luciferase assay system, normalized to internal control firefly luciferase activity. n=6. * P < 0.05, Student’s t-test; Means ± SEM.
Figure 4
Figure 4. Ectopic expression of miR-193b induces C2C12 to form brown adipocytes under adipogenic differentiation conditions
(a), C2C12 cells ectopically expressing miR-193b or control were exposed to pro-adipogenic conditions (described in Methods) for 5 days. ORO staining was used to assess lipid accumulation in cells. Representative micrographs of these cells are depicted (bottom row). (b). Western blot for myogenic markers Pax3, MyoD and brown fat marker Ucp1. n=3. (c), Real-time PCR analysis for expression of common adipogenesis markers (upper row) and brown fat selective markers (bottom row). n=3. (d), C2C12 cells expressing miR-193b (day 6) were stimulated with 500uM dibutyrul cAMP for 4h, and the expression of thermogenic markers, Pgc-1α and Ucp1 was examined by real-time PCR. n=3. (e), The metabolic profile of C2C12 cells expressing miR-193b (day 6) was assessed using the Seahorse XF24 Extracellular Flux Analyzer. A representative curve of the oxygen consumption rates (OCR) of control and miR-193b expressing cells at their basal states and upon treatment with drugs used to dissect the multiple components of the respiration process is plotted in the top-left panel. The parameters analyzed are represented by different colors in the upper panel and quantitated in other panels. In vitro differentiated primary brown adipocytes (BAT) were used as a reference. n=8. * P < 0.05, Student’s t-test; Means ± SEM.
Figure 5
Figure 5. miR-193b-365 is regulated by Prdm16
(a), Subcutaneous white pre-adipocytes (left) and C2C12 myoblasts (right) were infected by retrovirus expressing Prdm16 two days before differentiation. 5 days after differentiation, real-time PCR were performed to examine the expression of miR-193b, miR-365, and as a control miR-223. n=3. (b), Primary brown preadipocytes were infected by retrovirus expressing shRNA targeting Prdm16 two days before differentiation. By D5 of differentiation, real-time PCR was used to examine the mRNA level of Prdm16 (left), and miR-193b, miR-365, and the control miR-223 (right). n=3. (c), Real-time PCR analysis for Pparα in primary brown adipocytes retrovirally expressing shRNA for Prdm16. (d), Real-time PCR analysis of miR-193b, miR-365, Prdm16 and Ppara expression levels during adipogenesis of primary brown adipocyte cultures. n=3. (e), ChIP analysis for the interaction between Ppara and the promoter region of miR-193b-365. Immortalized brown adipocyte cultures (Day 5) were fixed and sheared by ultrasonication. Immunoprecipitation was performed with anti-Pparα and control IgG. Recovered DNA was amplified by 3 pairs (P1, P2 and P3) of primers designed to span the 1Kb promoter region. Input samples are in the top panel and immunoprecipitated ones in the bottom. (f), Primary brown preadipocytes were transfected with siRNA targeting Pparα, and differentiated for 3 days. RT- PCR was performed to examine the expression of Pparα, and miR-193b and miR-365. Pparγand miR-223 were used as controls. n=3. (g), RT-PCR was performed to examine the expression of miRNAs in brown adipose tissue isolated from Pparα knockout mice (8 week old, Male). Age-matched wild- type mice were used as control. n=6. * P < 0.05, Student’s t-test; Means ± SEM.

References

    1. Seale P, Kajimura S, Spiegelman BM. Transcriptional control of brown adipocyte development and physiological function--of mice and men. Genes Dev. 2009;23:788–797. - PMC - PubMed
    1. Gesta S, Tseng YH, Kahn CR. Developmental origin of fat: tracking obesity to its source. Cell. 2007;131:242–256. - PubMed
    1. Cypess AM, et al. Identification and importance of brown adipose tissue in adult humans. N Engl J Med. 2009;360:1509–1517. - PMC - PubMed
    1. van Marken Lichtenbelt WD, et al. Cold-activated brown adipose tissue in healthy men. N Engl J Med. 2009;360:1500–1508. - PubMed
    1. Virtanen KA, et al. Functional brown adipose tissue in healthy adults. N Engl J Med. 2009;360:1518–1525. - PubMed

Publication types

MeSH terms