. 2011 Jul 10;14(8):1033-8.
doi: 10.1038/nn.2862.

Cocaine supersensitivity and enhanced motivation for reward in mice lacking dopamine D2 autoreceptors

Affiliations

Cocaine supersensitivity and enhanced motivation for reward in mice lacking dopamine D2 autoreceptors

Estefanía P Bello et al. Nat Neurosci. .

Abstract

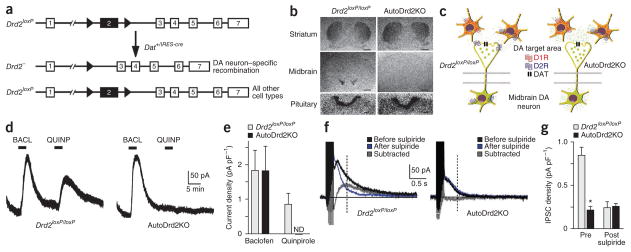
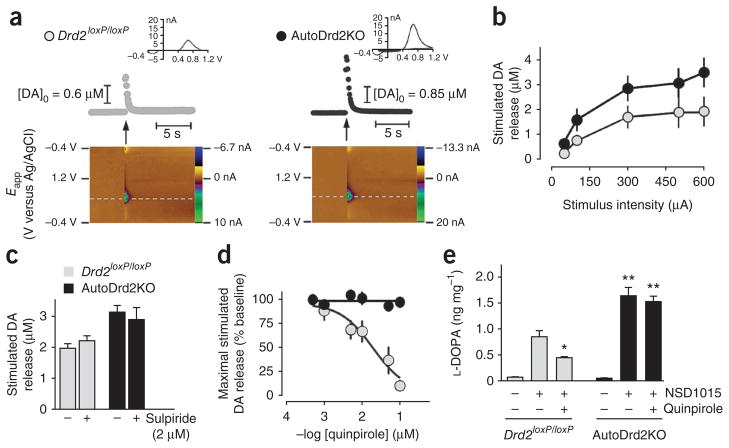
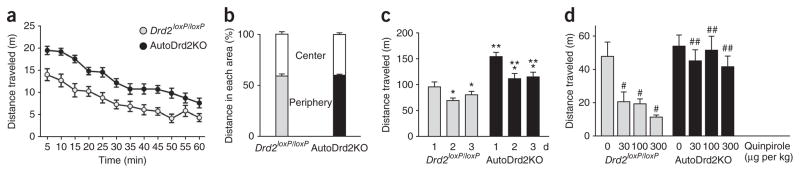
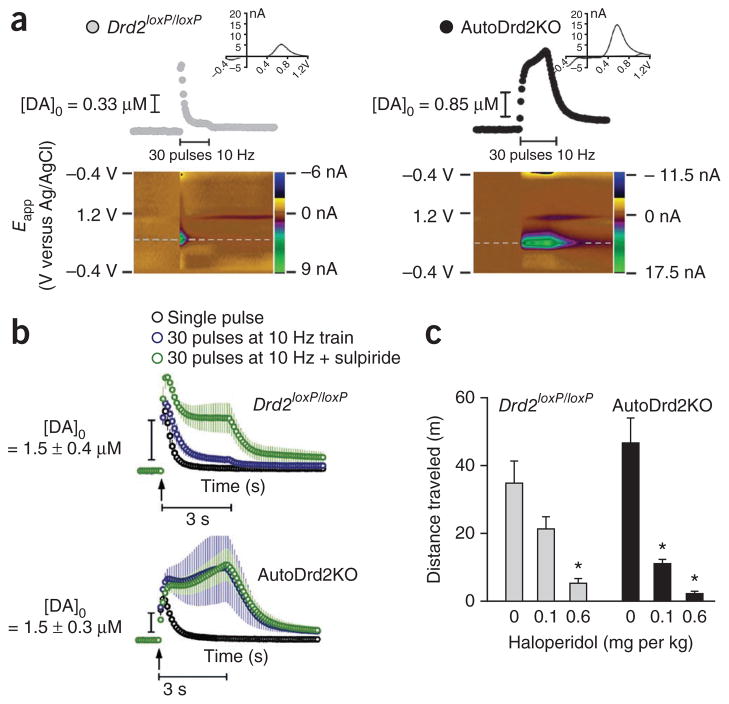
Dopamine (DA) D2 receptors expressed in DA neurons (D2 autoreceptors) exert a negative feedback regulation that reduces DA neuron firing, DA synthesis and DA release. As D2 receptors are mostly expressed in postsynaptic neurons, pharmacological and genetic approaches have been unable to definitively address the in vivo contribution of D2 autoreceptors to DA-mediated behaviors. We found that midbrain DA neurons from mice deficient in D2 autoreceptors (Drd2(loxP/loxP); Dat(+/IRES-cre), referred to as autoDrd2KO mice) lacked DA-mediated somatodendritic synaptic responses and inhibition of DA release. AutoDrd2KO mice displayed elevated DA synthesis and release, hyperlocomotion and supersensitivity to the psychomotor effects of cocaine. The mice also exhibited increased place preference for cocaine and enhanced motivation for food reward. Our results highlight the importance of D2 autoreceptors in the regulation of DA neurotransmission and demonstrate that D2 autoreceptors are important for normal motor function, food-seeking behavior, and sensitivity to the locomotor and rewarding properties of cocaine.


Figures

Figure 1
Figure 1
Selective ablation of DA D2 autoreceptors prevents somatodendritic D2 like–mediated inhibition of midbrain DA neurons. (a) Schematic of conditional mutagenesis in the mouse D2 receptor gene Drd2. Exon 2 (black) is flanked by loxP sites (black triangles). Drd2 exon 2 is excised by Cre in dopaminergic neurons in Drd2loxP/loxP; Dat+/IRES-cre, mice. (b) [3H]Nemonapride-binding autoradiography. Scale bars represent 1 mm for brain sections and 100 μm for pituitary sections. (c) Schematic comparing midbrain DA neurons of Drd2loxP/loxP and autoDrd2KO mice. The absence of D2 autoreceptors predicts enhanced DA synthesis and release. (d) Whole-cell voltage-clamp recordings (Vh = −55 mV) from midbrain DA neurons. Baclofen (BACL, 5 μM) and quinpirole (QUINP, 200 nM) were applied as indicated by horizontal black bars. (e) The current density induced by each agonist was plotted for neurons obtained from Drd2loxP/loxP and autoDrd2KO mice (n = 6–7). ND, not detected. (f) The averages of five traces showing IPSCs evoked by electrical stimulation before (black) and after (blue) sulpiride application, as well as the sulpiride-sensitive component (gray), are plotted. The dashed vertical lines indicate the average time to peak of the sulpiride-sensitive component of the IPSC (0.43 ± 0.10 s, n = 7) in Drd2loxP/loxP neurons. (g) IPSC densities measured at the average time to peak before and after sulpiride are shown for Drd2loxP/loxP and autoDrd2KO mice (n = 6–8). *P < 0.005. Error bars represent s.e.m.
Figure 2
Figure 2
Increased DA release and DA synthesis in autoDrd2KO mice. (a) DA release in the dorsal striatum evoked by a single stimulus pulse (300–600 μA, 0.6 ms per phase, biphasic; arrows). Top, time course of DA concentration changes. Insets represent the background-subtracted cyclic voltammograms indicative of DA. Bottom, two-dimensional representations of the voltammetric data. The voltammetric current is plotted against the applied potential (Eapp) and the acquisition time. (b) Input-output relationship of DA release elicited by single-pulse stimulation across a range of stimulus intensities in the dorsal striatum of Drd2loxP/loxP (n = 4) and autoDrd2KO mice (n = 5) (F1,29 = 10.27, P < 0.001). (c) Stimulated DA release in autoDrd2KO (n = 16) and control mice (n = 11) does not change in the presence of 2 μM sulpiride (Drd2loxP/loxP mice, n = 8; autoDrd2KO mice, n = 7). (d) Effect of quinpirole on electrically stimulated DA release (F5,34 = 17.94, P < 0.001). (e) Tyrosine hydroxylase activity assessed by L-DOPA accumulation in striata of Drd2loxP/loxP and autoDrd2KO mice receiving saline or 100 mg per kg, intraperitoneal, of NSD1015. Quinpirole (0.5 mg per kg, intraperitoneal) was given 30 min before NSD1015 (two-way ANOVA genotype × treatment interaction: F2,17 = 8.58, P < 0.005; treatment: F2,17 = 48.15, *P < 0.05 between NSD1015 treated mice receiving or not receiving quinpirole; genotype: F1,17 = 34.84, **P < 0.001, post hoc Fisher analysis). Error bars represent s.e.m.
Figure 3
Figure 3
Spontaneous locomotor hyperactivity in autoDrd2KO mice. (a) Locomotor activity in a novel open field for 60 min (repeated-measures ANOVA genotype: F1,21 = 6.32, P < 0.05). (b) AutoDrd2KO mice avoided the center of the open field, similar to control mice (one-way ANOVA: F1,27 = 0.17, P = 0.68). (c) Locomotor activity along three consecutive days (repeated-measures ANOVA time: F2,50 = 28.22, *P < 0.01 compared to day 1; repeated-measures ANOVA genotype: F1,25 = 15.60, **P < 0.001 compared to Drd2loxP/loxP mice). Both genotypes habituate similarly (time × genotype interaction: F2,50 = 2.97, P = 0.06). (d) Locomotor activity during 30 min after quinpirole (two-way ANOVA treatment: F1,45 = 15.18, #P < 0.001; genotype: F1,67 = 17.00, ##P < 0.001). Error bars represent s.e.m.
Figure 4
Figure 4
Normal DA reuptake and supersensitivity for cocaine in autoDrd2KO mice. (a) Representative electrically evoked (one pulse, arrows) DA signals before and after cocaine application. (b) Decay time constants (τ) of DA signal in the absence or presence of DAT blockers cocaine (COC) or methylphenidate (MPH) measured in autoDrd2KO (n = 14) and Drd2loxP/loxP mice (n = 11) (*P < 0.01). Error bars represent s.e.m. (c) Differential locomotor response to cocaine over 30 min (two-way ANOVA treatment: F2,39 = 88.91, #P < 0.001; genotype: F1,39 = 34.23, **P < 0.001; genotype × treatment interaction: F2,39 = 7.22, P < 0.05, post hoc Fisher analysis). (d) Mean s min−1 + s.e.m. spent on the drug-paired floor before and after 4 d of place preference conditioning using 5 mg per kg cocaine in Drd2loxP/loxP (n = 4) and autoDrd2KO mice (n = 4) (repeated-measures ANOVA conditioning: F1,6 = 93.05, ##P < 0.001; repeated-measures ANOVA genotype: F1,6 = 0.76, P = 0.42). (e) A tenfold lower dose of cocaine (0.5 mg per kg) induced place preference in autoDrd2KO mice (n = 6), but not in Drd2loxP/loxP mice (n = 6) (repeated-measures ANOVA genotype: F1,10 = 13.18, ***P < 0.05). Dashed lines indicate 50% of the test time (30 s). Error bars represent s.e.m.
Figure 5
Figure 5
AutoDrd2KO mice displayed supramaximal DA release during train stimulation. (a) DA release in dorsal striatum evoked by trains of 30 pulses delivered at 10 Hz and 10-min intervals (pulse duration of 0.6 ms, biphasic, amplitude of 600 μA). Top, time course of DA concentration changes with insets and color plots as described in Figure 2a. (b) Effect of sulpiride on train-evoked DA release. Each figure represents average concentration-time plots for eight Drd2loxP/loxP and nine autoDrd2KO mice. (c) Horizontal locomotor activity recorded over 30 min in mice receiving saline, 0.1 or 0.6 mg per kg (intraperitoneal) of haloperidol (two-way ANOVA drug: F2,17 = 21.71, *P < 0.001 compared with saline). Error bars represent s.e.m.
Figure 6
Figure 6
AutoDrd2KO mice displayed increased motivation to work for a natural reward. (a) Mice (n = 7 per genotype) were subjected to an escalating fixed ratio schedule (pressing 3, 10, 30 and 100 times) (repeated-measures ANOVA genotype: F1,11 = 4.92, *P < 0.05; interaction: F3,33 = 4.35, P < 0.05). (b) Progressive ratio (2n) schedule. Left, number of presses (one-way ANOVA presses: F1,14 = 6.37, **P < 0.01). Right, maximum number of pellets obtained (break point; one-way ANOVA: F1,14 = 8.94, *P < 0.05). (c) Two day extinction protocol for 60 min (no food delivered) (repeated-measures ANOVA, post hoc Fisher analysis genotype: F1,14 = 11.58, *P < 0.05). Error bars represent s.e.m.

Similar articles

Cited by

References

    1. Schultz W. Dopamine signals for reward value and risk: basic and recent data. Behav Brain Funct. 2010;6:24. - PMC - PubMed
    1. Goto Y, Otani S, Grace AA. The Yin and Yang of dopamine release: a new perspective. Neuropharmacology. 2007;53:583–587. - PMC - PubMed
    1. Volkow ND, Fowler JS, Wang GJ, Baler R, Telang F. Imaging dopamine’s role in drug abuse and addiction. Neuropharmacology. 2009;56 (suppl 1):3–8. - PMC - PubMed
    1. Kenny PJ. Reward mechanisms in obesity: new insights and future directions. Neuron. 2011;69:664–679. - PMC - PubMed
    1. Sulzer D. How addictive drugs disrupt presynaptic dopamine neurotransmission. Neuron. 2011;69:628–649. - PMC - PubMed

Publication types

MeSH terms