. 2011 Jul 10;14(8):965-72.
doi: 10.1038/nn.2859.

Neurod6 expression defines new retinal amacrine cell subtypes and regulates their fate

Affiliations

Neurod6 expression defines new retinal amacrine cell subtypes and regulates their fate

Jeremy N Kay et al. Nat Neurosci. .

Abstract

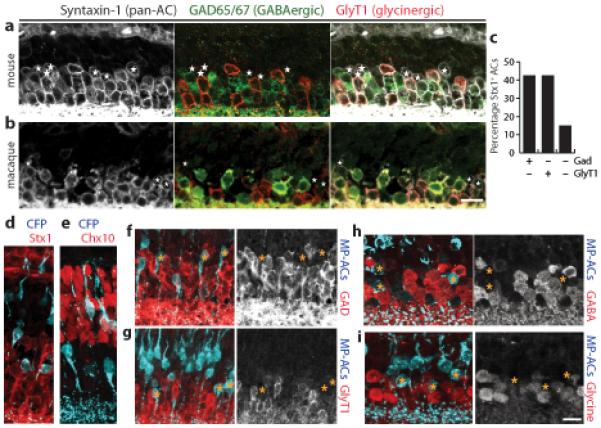
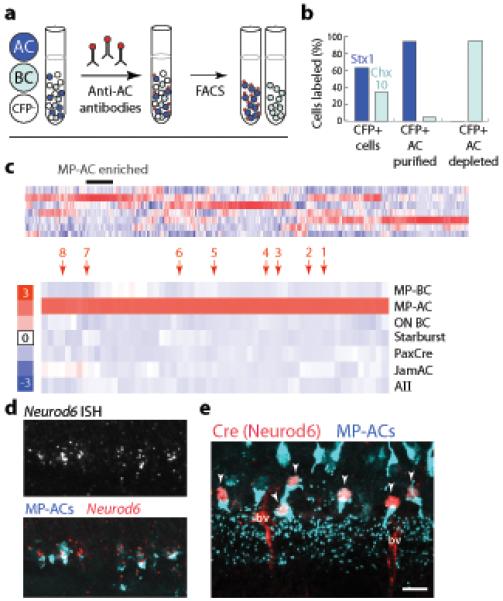
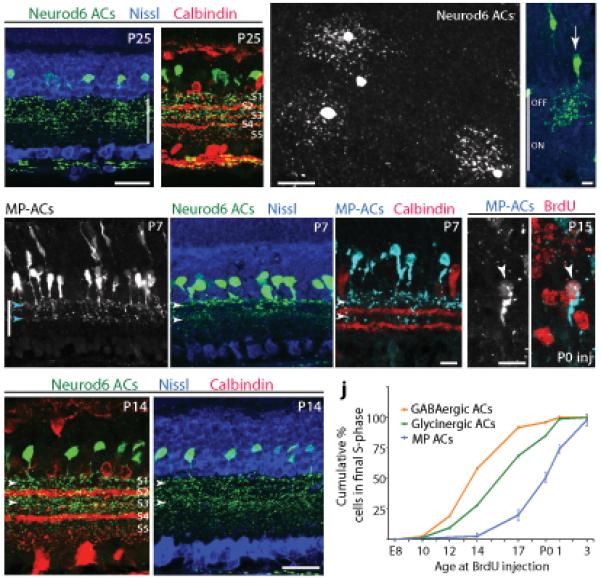
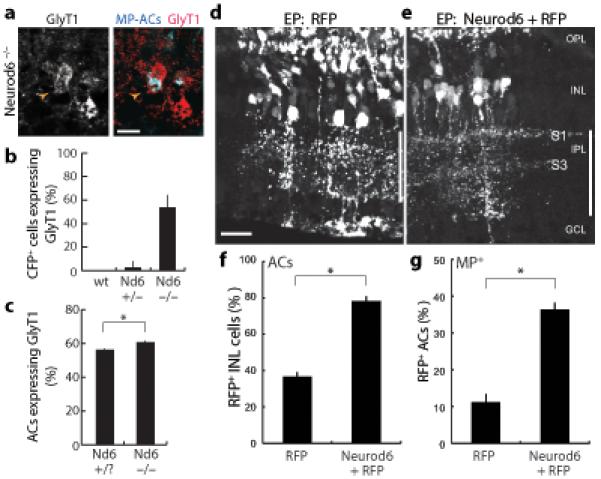
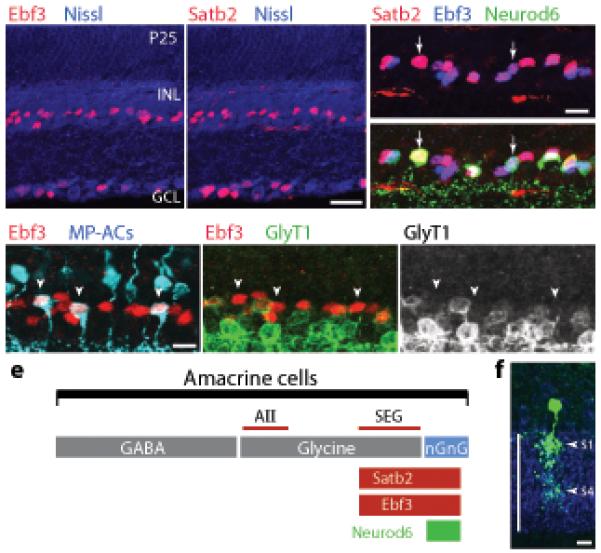
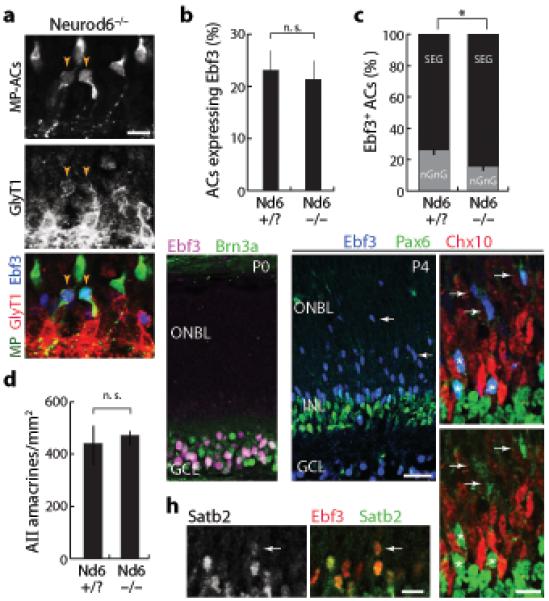
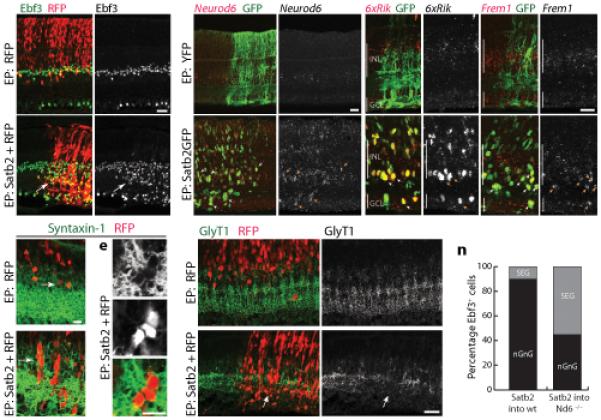
Most regions of the CNS contain many subtypes of inhibitory interneurons with specialized roles in circuit function. In the mammalian retina, the ∼30 subtypes of inhibitory interneurons called amacrine cells (ACs) are generally divided into two groups: wide/medium-field GABAergic ACs and narrow-field glycinergic ACs, which mediate lateral and vertical interactions, respectively, within the inner plexiform layer. We used expression profiling and mouse transgenic lines to identify and characterize two closely related narrow-field AC subtypes. Both arise postnatally and one is neither glycinergic nor GABAergic (nGnG). Two transcription factors selectively expressed by these subtypes, Neurod6 and special AT-rich-sequence-binding protein 2 (Satb2), regulate a postmitotic cell fate choice between these subtypes. Satb2 induces Neurod6, which persists in nGnG ACs and promotes their fate but is downregulated in the related glycinergic AC subtype. Our results support the view that cell fate decisions made in progenitors and their progeny act together to diversify ACs.


Figures

Figure 1
Figure 1. Non-GABAergic, non-glycinergic ACs
a,b: Mouse (a) and macaque (b) retina sections triple-stained for a pan-AC marker, Syntaxin-1 (white); a glycinergic AC marker, GlyT1 (red); and a GABAergic AC marker, GAD (green). Glycinergic and GABAergic ACs are mutually exclusive. Asterisks mark ACs that do not show GAD or GlyT1 immunoreactivity (nGnG ACs). c: Percentage of Syntaxin-1 (Stx1)-positive ACs that are GABAergic, glycinergic, or neither in adult mouse retina (n ≥ 200 cells counted for each cell type). d,e: Retinal sections from the MP transgenic mouse line stained with anti-GFP to reveal CFP+ cells (blue). A subset of Stx1+ ACs (red, d) and Chx10+ bipolar cells (red, e) are CFP+. The CFP+ AC and bipolar populations can be distinguished based on their laminar position within the INL. fi: CFP+ MP-ACs (blue) are not immunoreactive for GAD (f, red), GlyT1 (g, red), GABA (h, red) or glycine (i, red). Right panels show marker alone, with asterisks to mark the location of MP-ACs. Mouse tissue from P15 (a,dg) or adult (>P40) animals (h,i). Scale bar for (a,b) and for (di) = 10 μm.
Figure 2
Figure 2. Transcriptional profiling of MP-CFP+ amacrine and bipolar cells
a: Method used to purify CFP+ ACs and bipolar cells (BCs) from MP transgenic mice. Dissociated retina contains CFP cells (white), CFP+ ACs (dark blue), and CFP+ BCs (light blue). Monoclonal antibody VC1.1, recognizing a cell-surface epitope specific to ACs, was applied to the suspension, allowing a second fluorophore (red) to be introduced onto ACs. Two-color flow cytometry (FACS) was then used to collect CFP+VC1.1+ ACs or CFP+VC1.1 BCs. b: Purity of the sorted populations. CFP+ cells were plated with or without VC1.1-based sorting and stained for pan-AC (Stx1) or pan-BC (Chx10) markers. Expected cell types were strongly enriched. c: Top: Heatmap showing genes clustered according to their expression level across the 7 cell types in the microarray dataset. Scale (red = high; blue = low) indicates gene expression level in each cell type relative to the mean for that gene. MP-AC enriched genes are marked. Bottom: Portion of the heatmap containing genes that were strongly expressed by MP-ACs but not other cell types (labeled at right) in the dataset. Genes indicated by arrows: 1: Ebf3; 2: Neurod6; 3: 6430573F11rik; 4: Satb2; 5: Pde5a; 6: Galr2; 7: Frem1; 8: Pkdcc. d: ISH for Neurod6 in line MP retina at P7. Neurod6+ cells (red) are CFP+ (blue). e: Neurod6:Cre mice carrying the MP transgene immunostained for CFP and Cre at P15. All Cre+ cells (red) were CFP+ (arrowheads). Second antibodies non-specifically stain blood vessels (bv). Scale bar (d,e) = 10 μm.
Figure 3
Figure 3. Morphology and development of nGnG ACs
a,b: Morphology of ACs labeled in Nd6CY mice (anti-GFP, green). Anti-calbindin (red, b) marks IPL sublaminae S2, S3, and S4. Arbors of YFP+ ACs stratify predominantly in S1–S3. Nissl counterstain (blue, a) reveals retinal layers. c: Wholemount adult Nd6CY retina stained with anti-GFP, viewed en face. Narrow-field YFP+ cells are evident in this retinal region with sparse YFP labeling. d: Single nGnG cell from P20 retina (green), labeled with YFP-retrovirus, identified as nGnG using markers described in Methods. Blue = Nissl counterstain. nGnG ACs are multistratified in S1–S3. eg: Morphology of nGnG ACs in MP (e,g) and Nd6CY (f) mice at P7. Note bistratified projection to IPL strata S1 and S3 (arrowheads). h: Morphology of nGnG ACs at P14 (Nd6CY mice; green). Co-labeling with calbindin (red) or Nissl (blue). Projections to S1 and S3 are still prominent (arrowheads) but S2 is also labeled. i: Bromodeoxyuridine (BrdU) immunolabeling (red) in MP mice injected with BrdU at P0. Many nGnG ACs (left = gray; right = blue) are BrdU+ (arrowhead), indicating that they undergo their final cell cycle at P0. j: Birthdate curve for nGnG ACs, constructed by injecting BrdU at 9 time points (P5 not shown) and counting cells double-positive for CFP and BrdU at P15 (as in i). Plot shows cumulative percentage of MP-AC population born by a given age. For comparison, birthdate curves of GABAergic and glycinergic ACs are replotted from ref. . Scale bars (ac,h) = 25 μm; (dg,i) = 10 μm. Vertical bar in a,d,e = IPL.
Figure 4
Figure 4. Neurod6 regulates the nGnG vs. glycinergic fate decision
a,b: Many CFP+ MP-ACs adopt glycinergic fate in Neurod6 mutants. Double-labeling of Neurod6−/− sections for CFP (blue) and GlyT1 (red) reveals double-positive ACs (arrowhead). Quantification of CFP+GlyT1+ cells (b) shows large increase in mutants relative to wild-type or Neurod6+/− littermates, in which double-positive cells were almost never observed (p < 0.001; n ≥ 80 MP-ACs per genotype). Scale bar = 10 μm. c: More ACs (Pax6+) are glycinergic (GlyT1+) in Neurod6 mutants than in littermate controls (p < 0.01). d,e: Sections from retinas electroporated (EP) with red fluorescent protein (RFP) plasmid (d) or mix of Neurod6 and RFP plasmids (e). Vertical bar marks IPL. In control, cell bodies of transfected neurons are scattered throughout INL, and neuronal processes project throughout IPL. After Neurod6 electroporation, cell bodies of transfected ACs cluster in a single INL stratum and project preferentially to IPL sublaminae S1 and S3. OPL = outer plexiform layer. GCL = ganglion cell layer. Scale bar = 25 μm. f: Neurod6 promotes AC fate over other INL fates. Graph shows fraction of RFP+ INL cells that became ACs (Stx1+; p < 1×10⁻⁶; n ≥ 500 cells/experiment). In both experimental and control retinas, remaining non-AC RFP+ INL cells were bipolars (Chx10+) or Müller glia (Sox9+; not shown). g: Neurod6 promotes a subtype fate shift among ACs toward the nGnG fate. Graph shows fraction of RFP+ ACs that were MP-CFP+ (p < 0.001; n ≥ 50 CFP+ cells/experiment). Error bars = S.E.M. in all graphs; All animals were P15–17.
Figure 5
Figure 5. Satb2 and Ebf3 mark nGnG ACs and a related glycinergic subtype
a,b: Retinal sections stained with antisera against Ebf3 (a) or Satb2 (b). Immunoreactivity (red) is observed in nuclei of a subset of ACs in the INL and a subset of RGCs in the ganglion cell layer (GCL). Blue = Nissl counterstain. c: Staining for Ebf3 (blue), Satb2 (red), and Neurod6 (YFP+ cells, green in bottom panel) in the INL of Nd6CY retina. Top: Ebf3 and Satb2 are expressed by the same AC subset (pink-purple nuclei). Bottom: Virtually all Neurod6+ ACs express Satb2 and Ebf3 (arrows), although Neurod6 is expressed by only a subset of the Satb2+Ebf3+ population. d: Triple-staining for MP-ACs (blue) Ebf3 (red) and GlyT1 (green) reveals that all Ebf3+ ACs are either nGnG or glycinergic: CFP+Ebf3+ cells (arrowheads) do not express GlyT1 and Ebf3+GlyT1+ cells do not express the MP transgene. e: Schematic showing AC classes defined by neurotransmitter or by expression of Satb2, Ebf3, and Neurod6 transcription factors. Lines are drawn approximately to scale. The line labeled “SEG” denotes the population of ACs that are Satb2+Ebf3+GlyT1+. The size of the AII population was estimated from refs. and . f. Morphology of SEG ACs (green) in P20 retina, revealed by YFP-retrovirus. Cells were identified by triple staining for YFP, Ebf3 (not shown) and GlyT1 (blue). (see also Supplementary Fig. S5). Vertical line, IPL. Scale bars (a,b) = 25 μm; (cf) = 10 μm.
Figure 6
Figure 6. Neurod6 controls a postmitotic choice between nGnG and SEG fates
a: Section from MP; Neurod6−/- retina, triple-stained for MP-ACs (anti-GFP; green), GlyT1 (red), and Ebf3 (blue). MP-ACs that adopt glycinergic fate also express Ebf3 (arrowheads), consistent with a fate switch from nGnG to SEG ACs. b, c: Total size of the Ebf3+ AC population (b) is not changed in Neurod6 mutants relative to littermate controls, but the composition of the Ebf3+ population (c) is altered. Loss of Neurod6 reduces the fraction of Ebf3+ cells that are nGnGs, and increases the fraction that are GlyT1+ SEGs (c; p < 0.002; n > 450 cells). d: Glycinergic AII ACs (immunoreactive for Disabled1) were unaffected by Neurod6 mutation. Density was calculated from 20μm sections. (n = 4 samples each genotype). Animals were P15 (ad). eg: Ebf3 is expressed exclusively by postmitotic neurons in the developing retina. At P0 (e), Ebf3 (purple) is confined to Brn3a+ RGCs (green) in the ganglion cell layer (GCL). No expression is seen in the outer neuroblast layer (ONBL). At P4 (f,g), Ebf3 (blue) is expressed by migratory newborn Pax6+ ACs (green) in the ONBL (arrows) and by more mature Pax6+ ACs in the INL (asterisks). The Ebf3+ migratory cells do not express bipolar/Müller marker Chx10 (red). h: Satb2 (green) and Ebf3 (red) are coexpressed in the same AC population at P4, including migrating newborn ACs (arrow). Error bars = S.E.M. Scale bars (a,g,h) = 10 μm, (e,f) = 25 μm.
Figure 7
Figure 7. Satb2 promotes the nGnG fate by inducing Neurod6
a,b: Satb2 induces Ebf3. Electroporation (EP) with RFP plasmid alone (a) or Satb2 + RFP (b). Overproduction of Ebf3+ cells in Satb2-transfected retinal patches (b, arrow, yelllow cells) is evident relative both to adjacent untransfected territory and to control (a). Satb2+RFP+ cells are also shifted to the AC zone of the INL. ce: The AC zone of the INL (Stx1, green) contains more RFP+ cells in Satb2-overexpressing retina (d) than in controls (c). d,e: Clusters of Stx1+RFP+ACs form in Satb2-electroporated retina but not control. f,g: Electroporation of Satb2, but not YFP, induces Neurod6 expression in transfected cells (arrows). Compared to baseline endogenous expression (f), Neurod6 ISH signal is much higher in Satb2GFP+ retinal patches (g). hk: Electroporation of Satb2, but not YFP, induces expression of nGnG markers 6430573F11rik (6xRik; h,i) and Frem1 (j,k). Red in (fk): = ISH signal; green = transfected cells (anti-GFP). Arrows in (fk): Satb2GFP+Marker+ cells. l,m: Excess ACs induced by Satb2 are GlyT1-negative. Clusters of Satb2+RFP+ cells (m) produce striking discontinuities in the normal pattern of GlyT1 immunoreactivity because they are GlyT1 (arrow). n: The phenotype (nGnG or SEG) of supernumerary Ebf3+ ACs induced by Satb2 (as in b) was scored in wild-type (wt) and Neurod6 (Nd6) mutant mice. Loss of Nd6 function substantially blocked the ability of Satb2 to induce nGnG ACs. Instead, many of the excess Ebf3+ ACs were SEGs. N > 150 cells for each genotype. Mice were P7–9 (am) or P14 (n). Scale bars (a,b,fm) = 25 μm; (ce) = 10 μm.

References

    1. Cossart R. The maturation of cortical interneuron diversity: how multiple developmental journeys shape the emergence of proper network function. Curr Opin Neurobiol. epub 2010. - PubMed
    1. Goulding M, Pfaff SL. Development of circuits that generate simple rhythmic behaviors in vertebrates. Curr Opin Neurobiol. 2005;15:14–20. - PubMed
    1. MacNeil MA, Masland RH. Extreme diversity among amacrine cells: implications for function. Neuron. 1998;20:971–982. - PubMed
    1. Klausberger T, Somogyi P. Neuronal diversity and temporal dynamics: the unity of hippocampal circuit operations. Science. 2008;321:53–57. - PMC - PubMed
    1. Badea TC, Nathans J. Quantitative analysis of neuronal morphologies in the mouse retina visualized by using a genetically directed reporter. J Comp Neurol. 2004;480:331–351. - PubMed

Publication types

MeSH terms

Associated data