. 2011 May 10;7(5):1564-1574.
doi: 10.1021/ct1006696.

Assessing protein loop flexibility by hierarchical Monte Carlo sampling

Affiliations

Assessing protein loop flexibility by hierarchical Monte Carlo sampling

Jerome Nilmeier et al. J Chem Theory Comput. .

Abstract

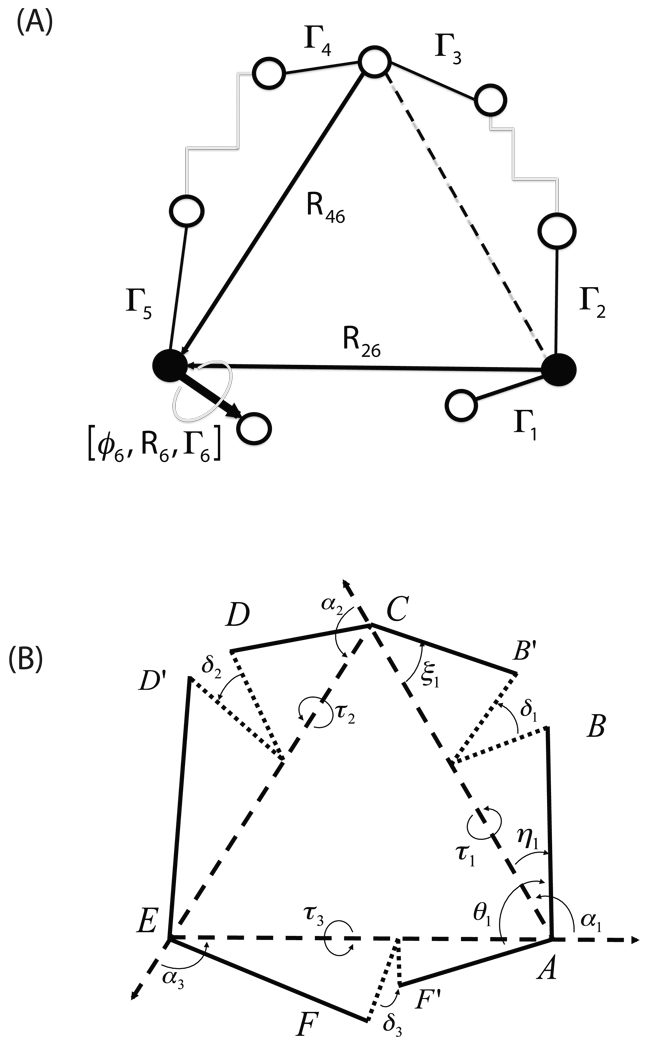
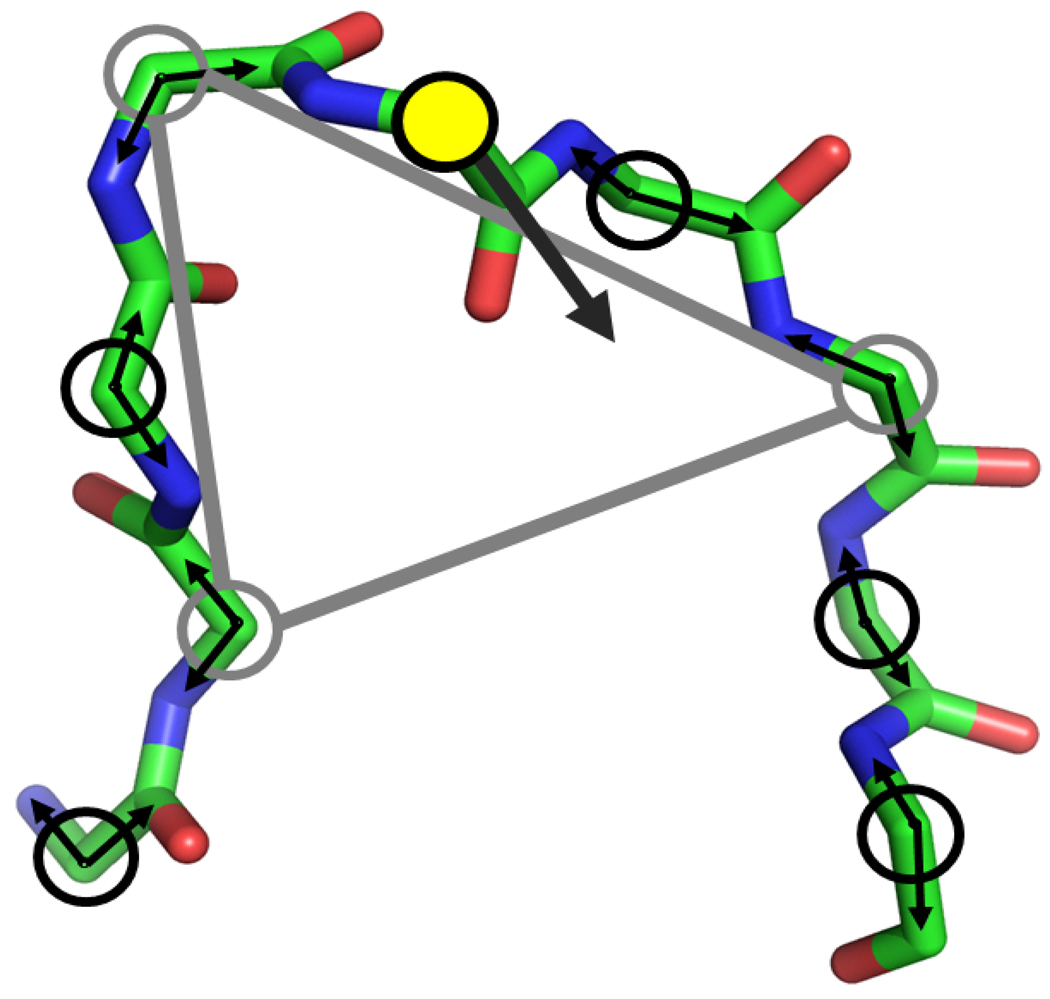
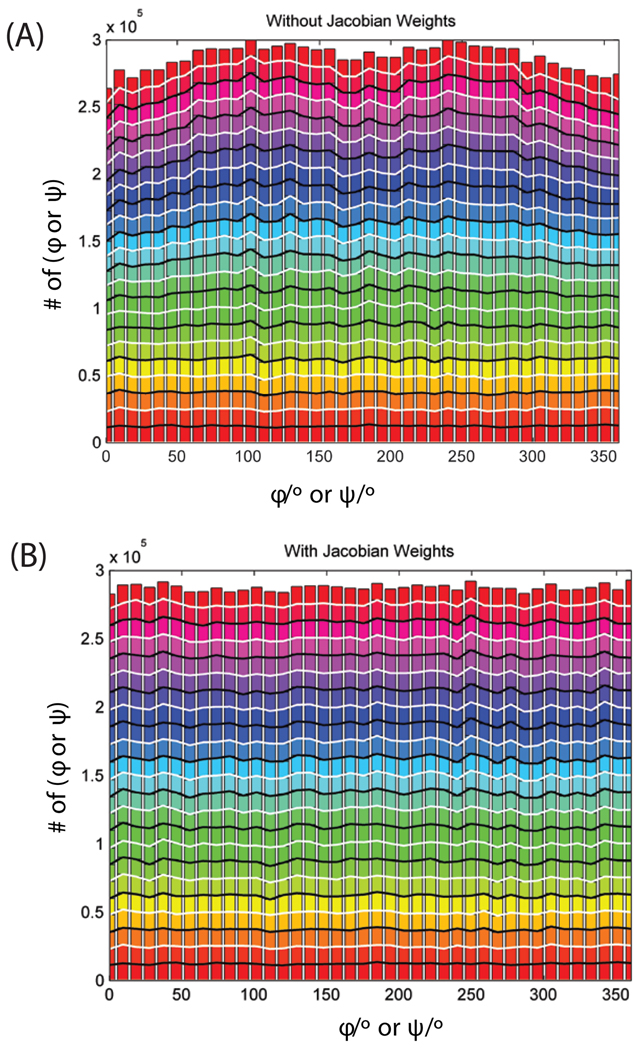
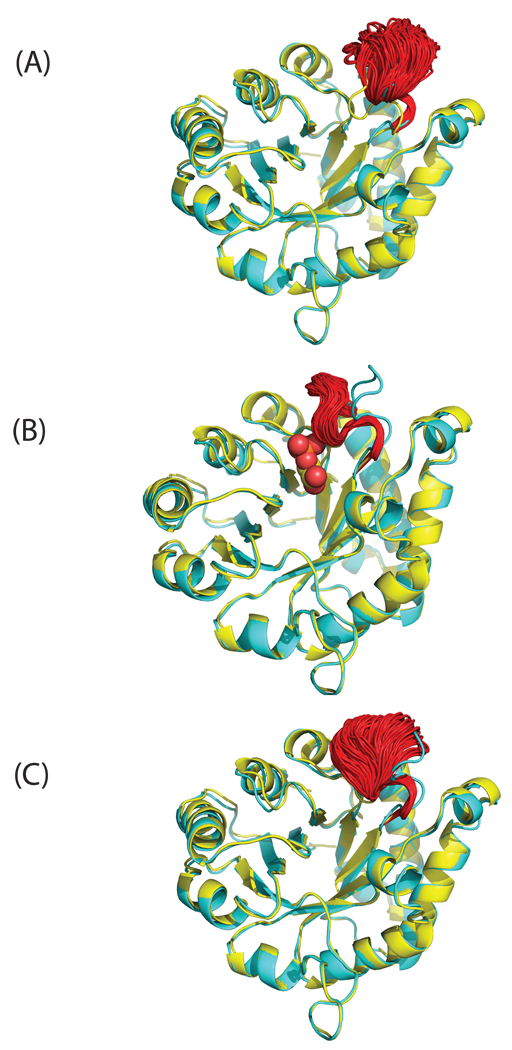
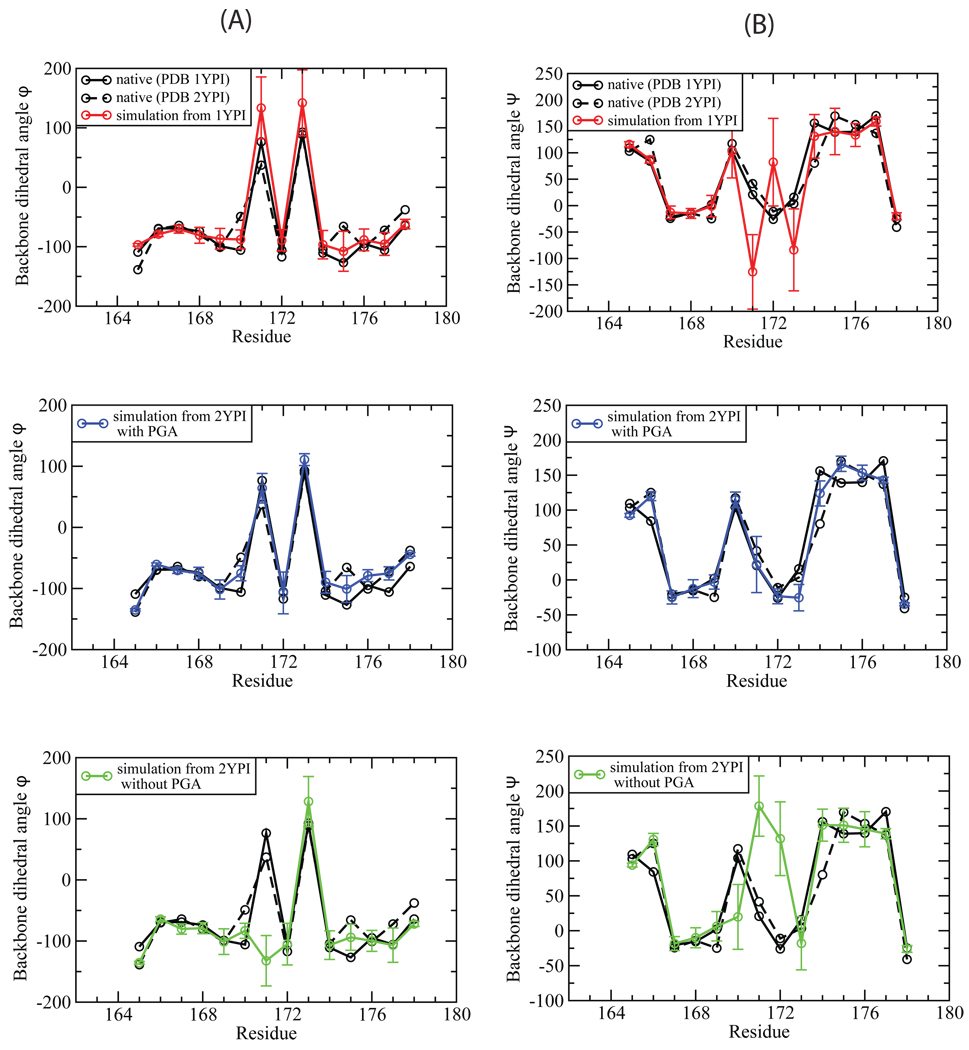
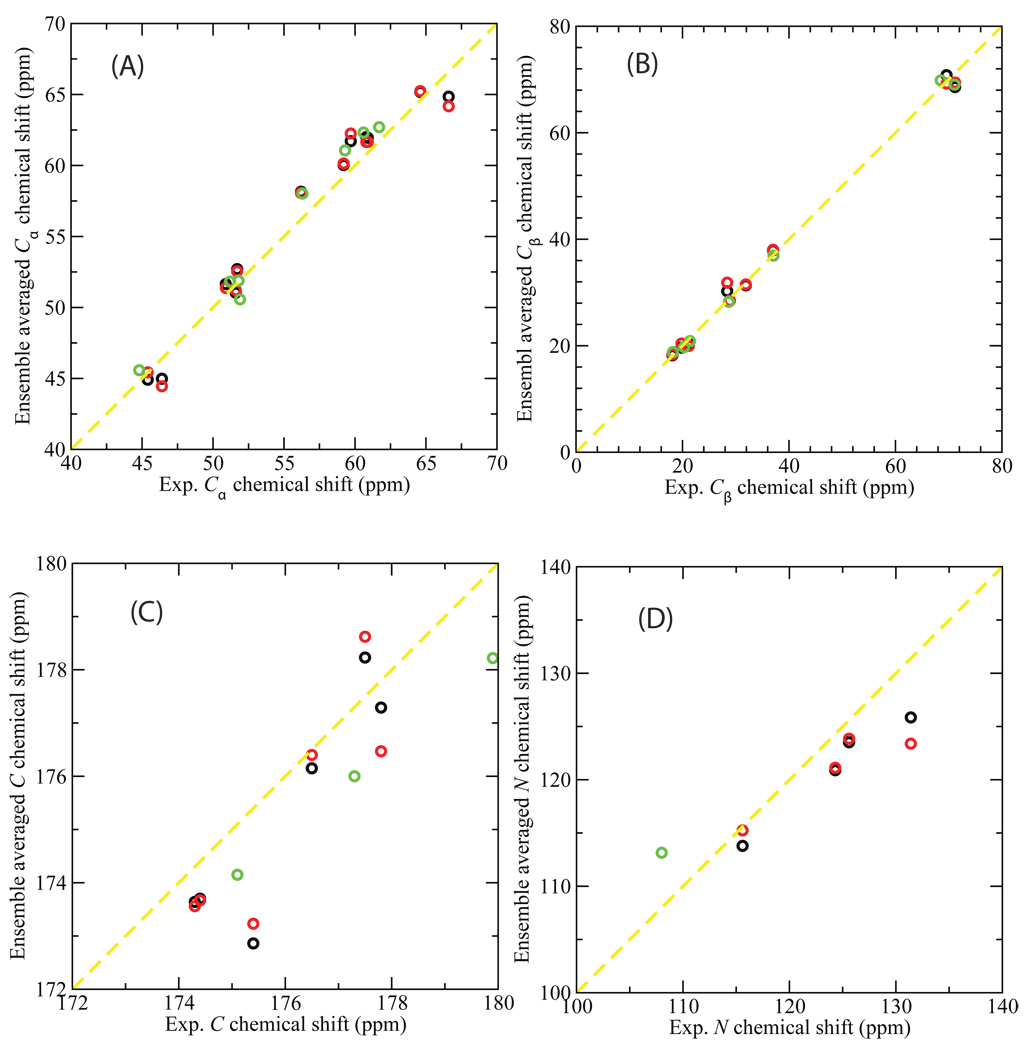
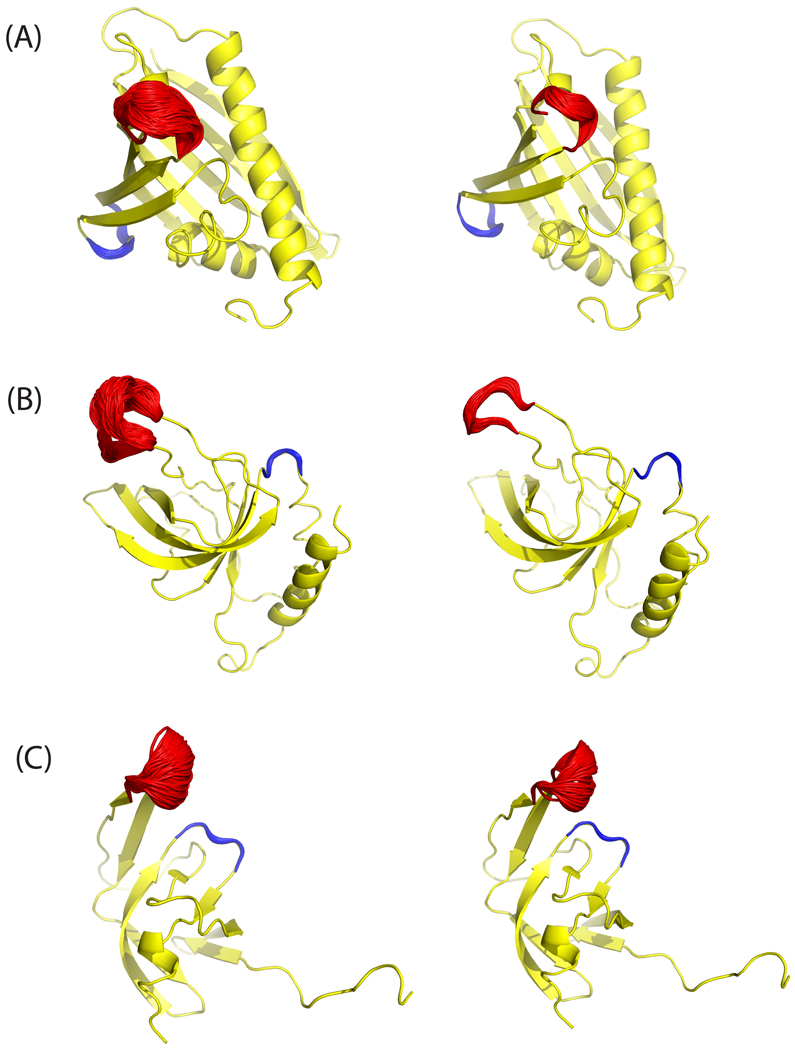
Loop flexibility is often crucial to protein biological function in solution. We report a new Monte Carlo method for generating conformational ensembles for protein loops and cyclic peptides. The approach incorporates the triaxial loop closure method which addresses the inverse kinematic problem for generating backbone move sets that do not break the loop. Sidechains are sampled together with the backbone in a hierarchical way, making it possible to make large moves that cross energy barriers. As an initial application, we apply the method to the flexible loop in triosephosphate isomerase that caps the active site, and demonstrate that the resulting loop ensembles agree well with key observations from previous structural studies. We also demonstrate, with 3 other test cases, the ability to distinguish relatively flexible and rigid loops within the same protein.


Figures

Fig. 1
Fig. 1
(A) The atoms and parameters defining triaxial loop closure (TLC). (B) The generalized 6R/3A kinematic chain.
Fig. 2
Fig. 2
Construction of a tripeptide move. A node consists of a ϕ/ψ pair at each alpha carbon of the loop (with only backbone shown). The yellow filled circle is the alpha carbon whose dihedral angle servers as a driver angle (the wide black arrow). A randomly constructed triaxial closure is shown as the grey triangle in which each grey circle represents the randomly selected pivot.
Fig. 3
Fig. 3
Distribution of ϕ/ψ angles without (A) and with (B) Jacobian weighting of selection for an 11-residue peptide. A Total of 4.5 × 10⁵ trial moves were generated. No forcefield is used the selection probability, and all trial moves are accepted.
Fig. 4
Fig. 4
The ensemble structures (red) for the flexible loop (residues 165–178) of yeast TIM were taken from the equilibrium simulation with initial structures of (A) apo (open) conformation, (B) bound (closed) conformation and (C) the closed conformation with the ligand PGA removed. The X-ray structure of apo yeast TIM (PDB 1YPI) is shown in yellow and bound state (PDB 2YPI) in cyan. The ligand PGA is depicted by spheres.
Fig. 5
Fig. 5
The comparison of the calculated backbone dihedral angles, ϕ (A) and ψ (B), with those measured in the X-ray structures. The black solid line is for apo TIM (PDB 1YPI) and the dashed line for the ligand-bound TIM (PDB 2YPI). The calculated dihedral angles were averaged over the equilibrium ensemble simulated from the initial structure of apo (red), ligand-bound (blue), and closed form with the ligand PGA removed (green).
Fig. 6
Fig. 6
Ensemble-averaged chemical shifts (ppm) versus the NMR experimental measurements for Cα (A), Cβ (B), carbonyl C (C), and amide N (D) atoms of the flexible loop 6 of yeast TIM. SHIFTX was used to calculate chemical shifts which were then averaged over an ensemble of 1000 structures from the equilibrated MC simulations. The starting PDB structures for the simulations are: 1YPI (black); 2YPI with the ligand PGA removed (red); and 2YPI with PGA bound (green). The experimental chemical shift data are those for apo yeast TIM in NMR experiment (for comparison with the apo simulations), and for yeast TIM with ligand G3P (for comparison with the holo simulation). Experimental chemical shifts are not available for some atoms and these are omitted.
Fig. 7
Fig. 7
Ensembles of loop structures from equilibrium simulations using MC sampling for proteins with PDB ID: (A) 1H2O, (B) 1XWE and (C) 1Q9P sampled at T=600 K (left) and T=300 K (right). The sampled flexible loops (‘floppy’) which have large fluctuation in the NMR models are shown in red and the rigid loops with very small fluctuations are in blue. The structures in yellow are taken from MODEL 1 of the PDB file.

Similar articles

Cited by

References

    1. Jones D. Curr Opin Struct Biol. 1997;7:377. - PubMed
    1. Fiser A, Do R, Sali A. Protein Sci. 2000;9:1753. - PMC - PubMed
    1. Al-Lazikani B, Jung J, Xiang Z, Honig B. Curr Opin Struct Biol. 2001;5:51. - PubMed
    1. Jacobson MP, Pincus D, Rapp C, Day T, Honig B, Shaw D, Friesner R. Proteins. 2004;55:351. - PubMed
    1. Meirovich H. Chem Phys Lett. 1977;45:389.

LinkOut - more resources