. 2011 Jan 1;1(1):100-8.
doi: 10.1016/j.preghy.2010.12.001.

The Impact of Preeclampsia on Gene Expression at the Maternal-Fetal Interface

Affiliations

The Impact of Preeclampsia on Gene Expression at the Maternal-Fetal Interface

Virginia D Winn et al. Pregnancy Hypertens. .

Abstract

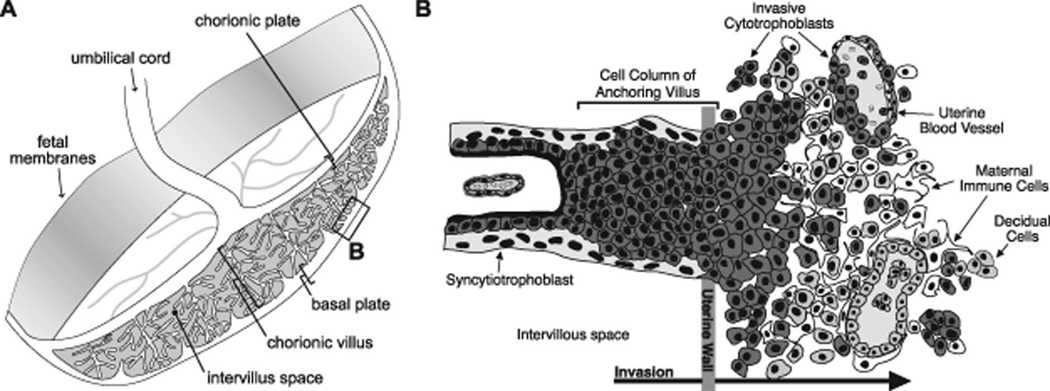
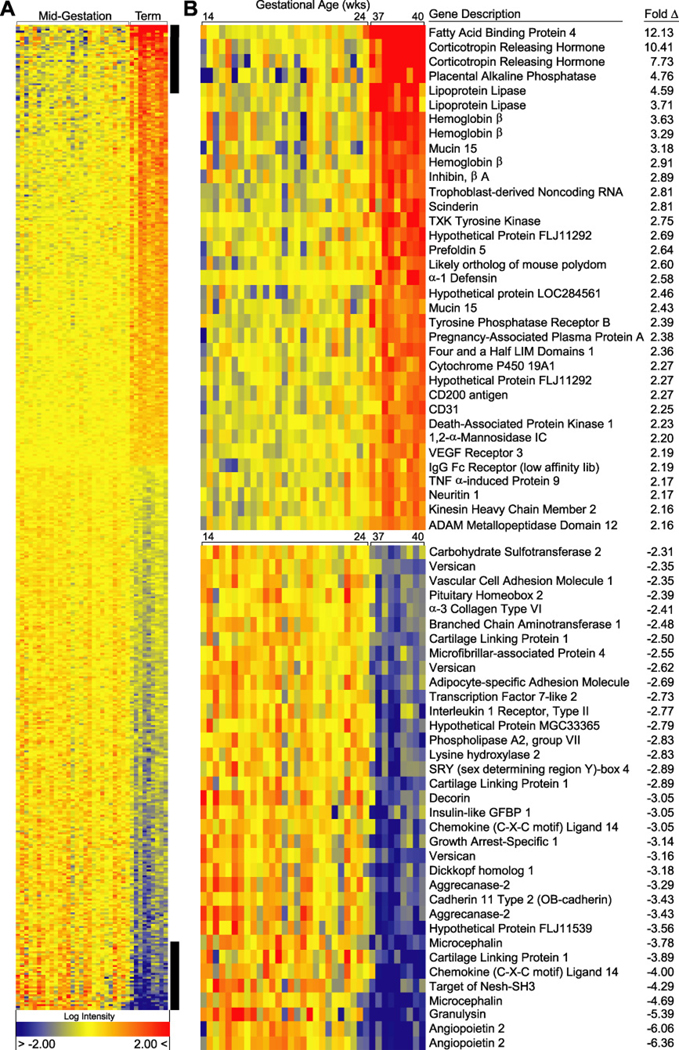
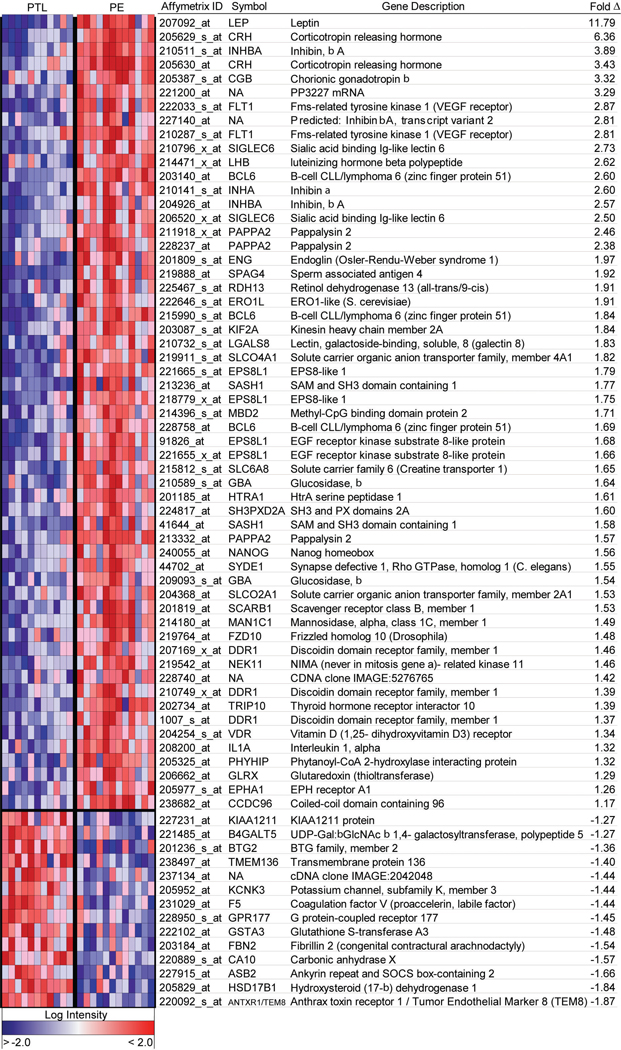
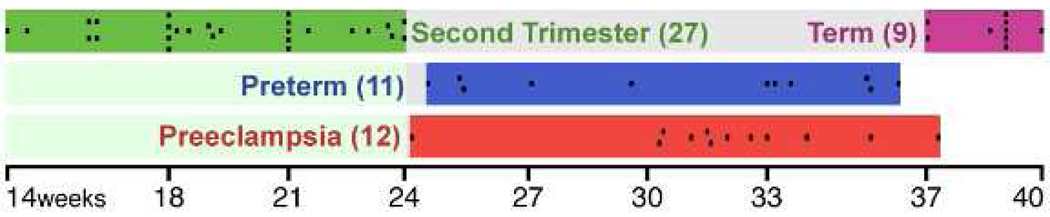
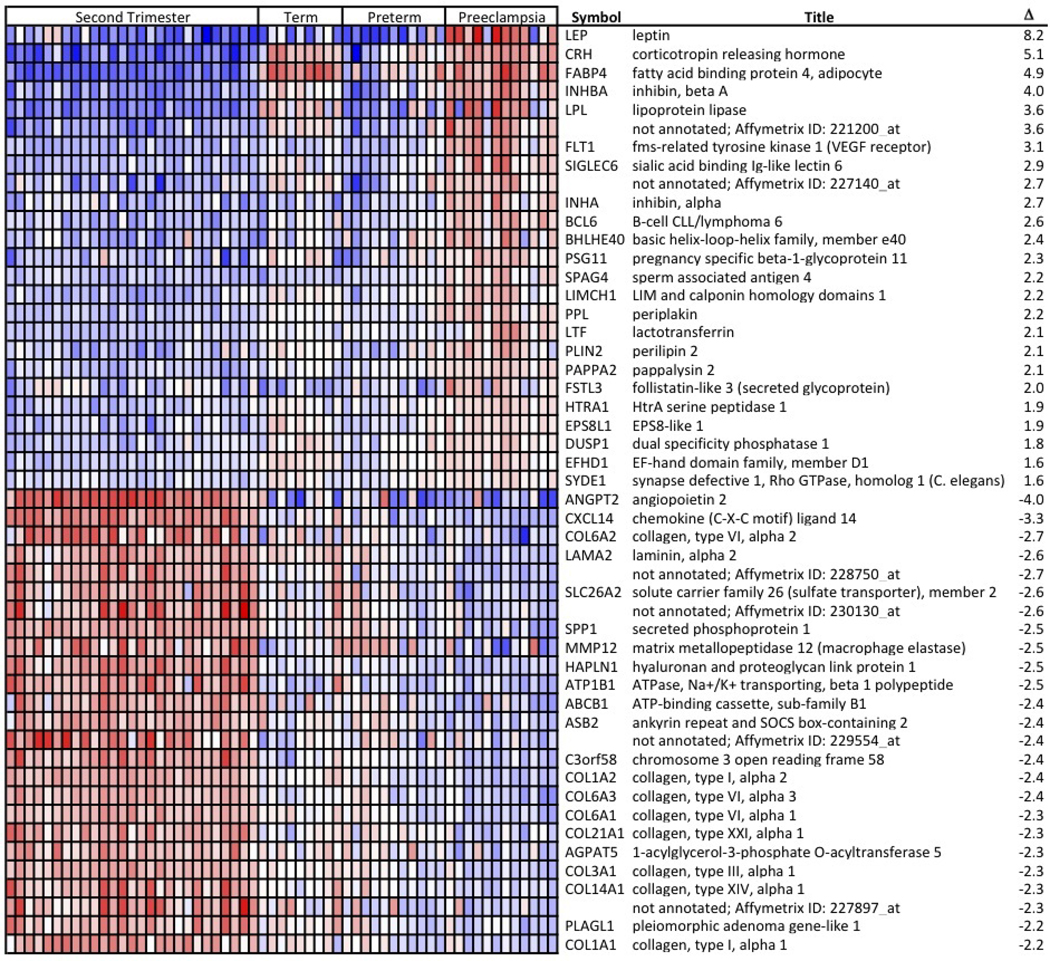
Preeclampsia (PE) impacts 8 million mother-infant pairs worldwide each year. This human pregnancy-specific disease characterized by hypertension and proteinuria accounts for significant maternal and neonatal morbidity and mortality. The current theory of the pathogenesis of PE as reviewed by Drs. Christopher Redman and Ian Sargent is thought to occur as a 2-stage process with poor placentation in the first half of pregnancy resulting in the maternal response in the second half of pregnancy. Our studies have focused on understanding the placental contribution to this serious disease by examining the gene expression profile of the deciduas basalis or basal plate, the region of the placenta involved in the "poor placentation". In this review we present summaries of our microarray datasets both of normal placentation and those gene expression changes resulting in the context of PE. Additionally, we have taken this opportunity to combine the data sets to provide a more comprehensive view of this region of the placenta. As defects in the basal plate are, in part, at the root of the disease process, we believe that understanding the pathobiology that occurs in this region will increase our ability to alter the development and/or course of PE.


Figures

Figure 1
Figure 1. Diagram of the human maternal-fetal interface
(A) Representation of the human placenta after delivery. The placental surface that was adjacent to the uterine wall is termed the basal plate. The boxed area denotes the region biopsied for these studies. (B) View of the basal plate at the cellular level. This chimeric region of the placenta is composed of both maternal and fetal cells: extravillous (invasive) cytotrophoblasts (dark grey), decidual cells (light grey), remodeled vasculature (both invasive CTBs and maternal endothelium) and maternal immune cells (white). (Reproduced with permission from Endocrinology (13)).
Figure 2
Figure 2. Heat map of the most highly up regulated (upper panel) and down regulated (lower panel) differentially expressed genes in the basal plate region at term in normal pregnancy
The normalized log intensity values were centered to the median value of each probe set and colored on a range of −2 to +2. Red denotes up regulated, yellow denotes intermediate, and blue denotes down regulated expression levels as compared with the median value. Columns contain data from a single basal plate specimen, and rows correspond to a single probe set. Samples are arranged from left to right, ordered by increasing gestational age. Rows are ranked by fold change (mean term value [n = 9] divided by mean midgestation value [n = 27]). (Reproduced with permission from Endocrinology (13))
Figure 3
Figure 3. Heat map of differentially expressed genes in basal plates of PE placentas as compared to controls
The normalized log intensity values for 71 differentially expressed probe sets were centered to the median value of each probe set and colored on a range of −2.5 to +2.5. Red denotes upregulated and blue denotes downregulated expression levels as compared with the median value. Columns contain data from a single basal plate specimen, and rows correspond to a single probe set. Samples are arranged from left to right, ordered by increasing gestational age within each category. Rows are ranked by fold change (mean PE value [n = 12] divided by mean PTL value [n = 11]). (Reproduced with permission from Endocrinology (42)).
Figure 4
Figure 4. Gestational Timeline of Basal Plate Biopsies Used in the Composite Analysis
The microarray data from human basal plate biopsies were used in a combined analysis. Each black box represents one individual placenta and is listed by gestational age and condition.
Figure 5
Figure 5. Heat map of the most highly up regulated and down regulated differentially expressed genes in basal plates of PE placentas as compared to the second trimester, term and preterm labor samples
The normalized log intensity values for the differentially expressed probe sets were centered to the median value of each probe set and colored on a range of −2.5 to +2.5. Red denotes up regulated and blue denotes down regulated expression levels as compared with the median value. Columns contain data from a single basal plate specimen, and rows correspond to a single probe set. Samples within each catergory are arranged from left to right, ordered by increasing gestational age. Rows are ranked by fold change. The complete heat map is shown in supplemental Fig. S1.

References

    1. Damsky CH, Librach C, Lim KH, Fitzgerald ML, McMaster MT, Janatpour M, et al. Integrin switching regulates normal trophoblast invasion. Development. 1994 Dec;120(12):3657–3666. - PubMed
    1. Zhou Y, Fisher SJ, Janatpour M, Genbacev O, Dejana E, Wheelock M, et al. Human cytotrophoblasts adopt a vascular phenotype as they differentiate. A strategy for successful endovascular invasion? J Clin Invest. 1997 May 1;99(9):2139–2151. - PMC - PubMed
    1. Red-Horse K, Zhou Y, Genbacev O, Prakobphol A, Foulk R, McMaster M, et al. Trophoblast differentiation during embryo implantation and formation of the maternal-fetal interface. J Clin Invest. 2004 Sep;114(6):744–754. - PMC - PubMed
    1. Clark DE, Smith SK, Licence D, Evans AL, Charnock-Jones DS. Comparison of expression patterns for placenta growth factor, vascular endothelial growth factor (VEGF), VEGF-B and VEGF-C in the human placenta throughout gestation. J Endocrinol. 1998 Dec;159(3):459–467. - PubMed
    1. Zhou Y, McMaster M, Woo K, Janatpour M, Perry J, Karpanen T, et al. Vascular endothelial growth factor ligands and receptors that regulate human cytotrophoblast survival are dysregulated in severe preeclampsia and hemolysis, elevated liver enzymes, and low platelets syndrome. Am J Pathol. 2002 Apr;160(4):1405–1423. - PMC - PubMed