. 2012 Feb;93(3):1281-94.
doi: 10.1007/s00253-011-3428-7. Epub 2011 Jul 9.

Effect of different salt adaptation strategies on the microbial diversity, activity, and settling of nitrifying sludge in sequencing batch reactors

Affiliations

Effect of different salt adaptation strategies on the microbial diversity, activity, and settling of nitrifying sludge in sequencing batch reactors

João Paulo Bassin et al. Appl Microbiol Biotechnol. 2012 Feb.

Abstract

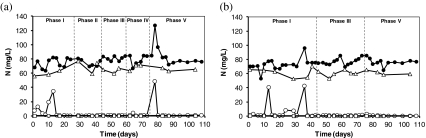
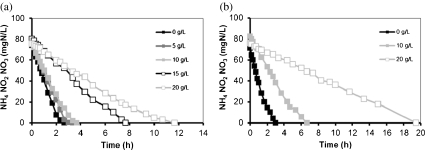
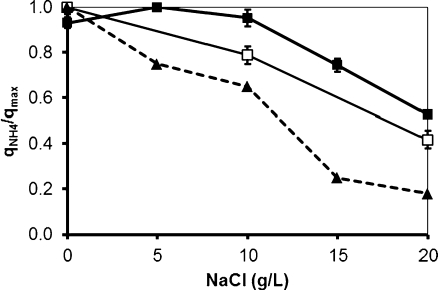
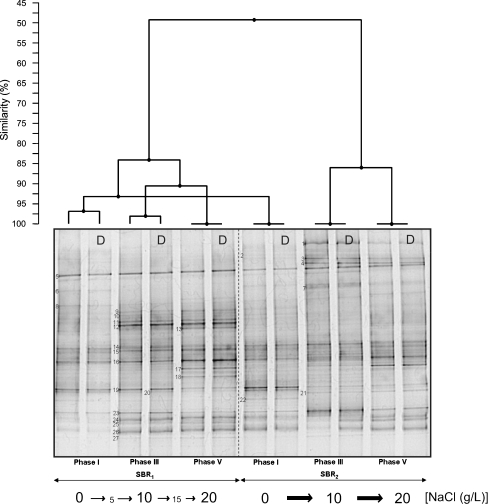
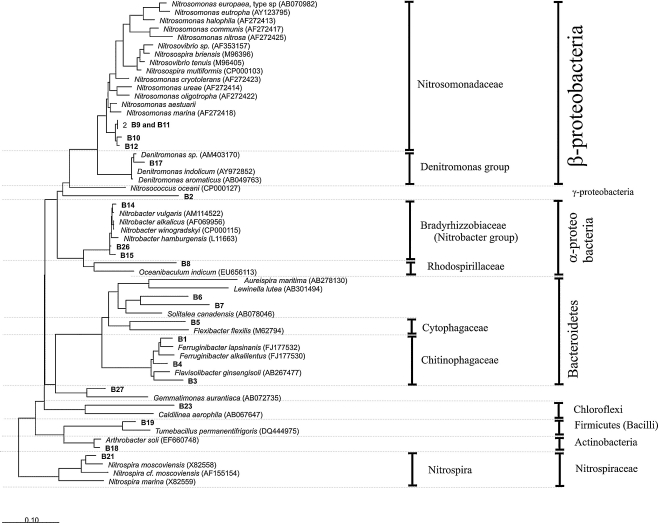
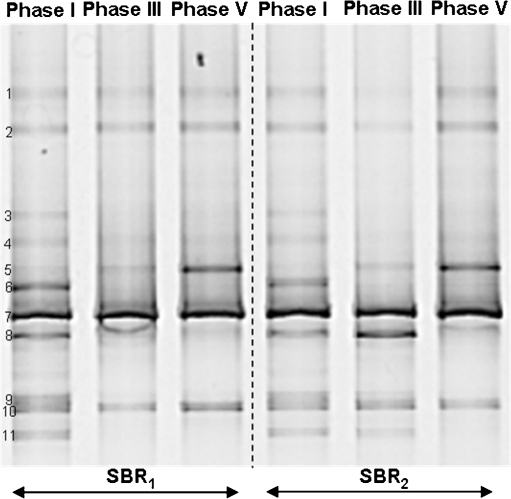
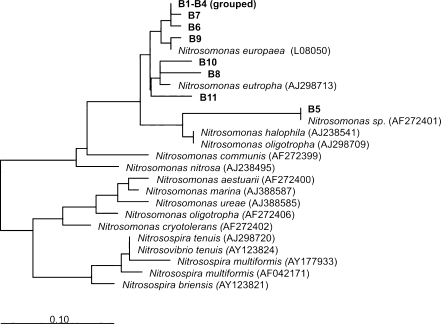
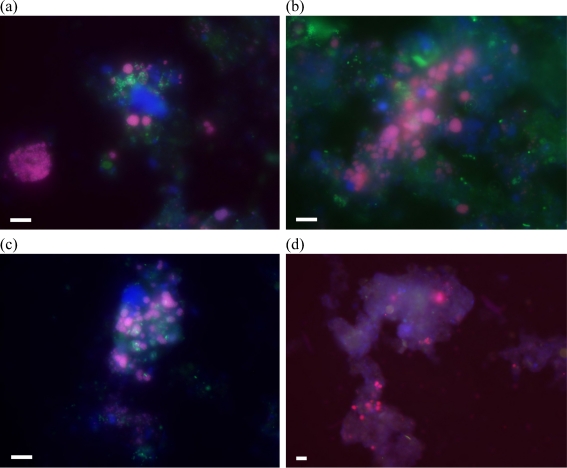
The effect of salinity on the activity of nitrifying bacteria, floc characteristics, and microbial community structure accessed by fluorescent in situ hybridization and polymerase chain reaction-denaturing gradient gel electrophoresis techniques was investigated. Two sequencing batch reactors (SRB₁ and SBR₂) treating synthetic wastewater were subjected to increasing salt concentrations. In SBR₁, four salt concentrations (5, 10, 15, and 20 g NaCl/L) were tested, while in SBR₂, only two salt concentrations (10 and 20 g NaCl/L) were applied in a more shock-wise manner. The two different salt adaptation strategies caused different changes in microbial community structure, but did not change the nitrification performance, suggesting that regardless of the different nitrifying bacterial community present in the reactor, the nitrification process can be maintained stable within the salt range tested. Specific ammonium oxidation rates were more affected when salt increase was performed more rapidly and dropped 50% and 60% at 20 g NaCl/L for SBR₁ and SBR₂, respectively. A gradual increase in NaCl concentration had a positive effect on the settling properties (i.e., reduction of sludge volume index), although it caused a higher amount of suspended solids in the effluent. Higher organisms (e.g., protozoa, nematodes, and rotifers) as well as filamentous bacteria could not withstand the high salt concentrations.


Figures

Fig. 1
Fig. 1
Ammonium concentration in the influent (filled circle) and ammonium (empty circle), nitrate (diamond), and nitrite (empty square) concentrations in the effluent of SBR1 (a) and SBR2 (b) during the whole experimental period
Fig. 2
Fig. 2
Ammonium profiles obtained in the cycle measurements in SBR1 (a) and SBR2 (b) during different operational phases
Fig. 3
Fig. 3
Specific ammonia oxidation rate (q NH4) as a fraction of the maximum ammonia oxidation rate (q max) obtained during the operation of SBR1 (filled square) and SBR2 (empty square) reactor under different salt concentration. Data from Moussa et al. (2006) are shown in dotted lines
Fig. 4
Fig. 4
DGGE gel banding profile of microbial community of the sequencing batch reactors exposed to increasing salt concentrations. Cluster analysis showing the similarities between different DGGE fingerprints is displayed graphically as a dendogram. D indicates the duplicate of each sample
Fig. 5
Fig. 5
Neighbor-joining tree of the sequences retrieved from the 16S rRNA gene DGGE analysis. Sequences determined in this work are printed in bold. The bar indicates 10% sequence difference. The sequence of Nitrosopumilus maritimus (Archaea) was used as an outgroup, but was pruned from the tree
Fig. 6
Fig. 6
DGGE banding patterns showing the ammonia-oxidizing bacteria (AOB) composition over the experimental phases
Fig. 7
Fig. 7
Maximum likelihood phylogeny of bacterial amoA sequences from DNA retrieved from the DGGE gel. The bar indicates 10% sequence difference. The sequence of Nitrosococcus halophilus was used as an outgroup, but was pruned from the tree
Fig. 8
Fig. 8
AOB (in red) and NOB (in green) populations within the whole bacterial community (in blue): a SBR1, phase I; b SBR1, phase V; c SBR2, phase I; and d SBR2, phase V. AOB appear violet due to superposition of the red-labeled AOBmix and the blue-labeled EUBmix probes, while NOB appear turquoise due to the superposition of green-labeled NOBmix and the blue-labeled EUBmix probes. Scale bar indicates 5 μm

References

    1. APHA American Public Health Association (1995) Standard methods for the examination of water and wastewater, 21st, centennial edition. APHA, Washington
    1. Amann RI, Binder BJ, Olson RJ, Chisholm SW, Devereux R, Stahl DA. Combination of 16S rRNA-targeted oligonucleotide probes with flow cytometry for analyzing mixed microbial populations. Appl Environ Microbiol. 1990;56:1919–609. - PMC - PubMed
    1. Anthonisen AC, Loher RC, Prakasam TBS, Srinath E. Inhibition of nitrification by ammonia and nitrous acid. J Water Pollut Control Fed. 1976;48:835–852. - PubMed
    1. Bassin JP, Dezotti M, Sant’Anna GL., Jr Nitrification of industrial and domestic saline wastewaters in moving bed biofilm reactor and sequencing batch reactor. J Haz Mat. 2011;185:242–248. doi: 10.1016/j.jhazmat.2010.09.024. - DOI - PubMed
    1. Blackburne R, Vadivelu VM, Yuan Z, Keller J. Determination of growth rate and yield of nitrifying bacteria by measuring carbon dioxide uptake rate. Water Environ Res. 2007;79:2437–2445. doi: 10.2175/106143007X212139. - DOI - PubMed

Publication types

LinkOut - more resources