

Analysis of chloroquine resistance transporter (CRT) isoforms and orthologues in S. cerevisiae yeast
- PMID: 21744797
- PMCID: PMC3155940
- DOI: 10.1021/bi200922g
Analysis of chloroquine resistance transporter (CRT) isoforms and orthologues in S. cerevisiae yeast
Abstract
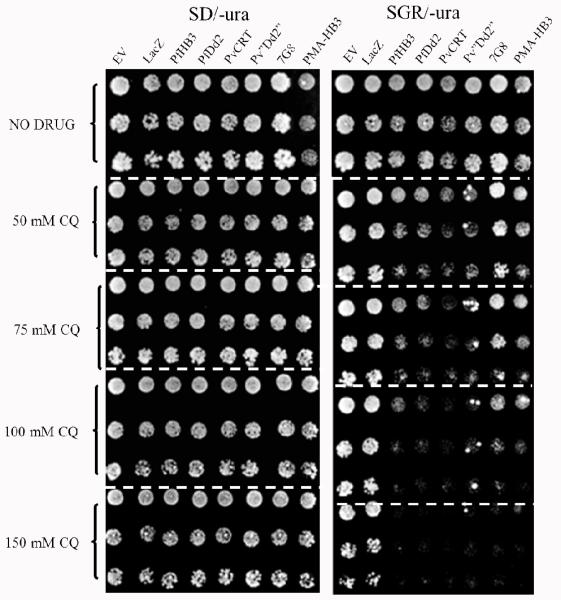
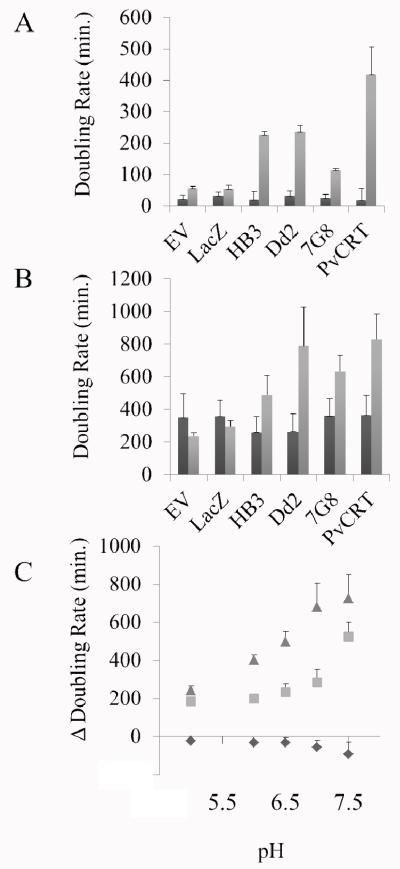
Previous work from our laboratory optimized MeOH-inducible expression of the P. falciparum malarial parasite transporter PfCRT in P. pastoris yeast. These strains are useful for many experiments but do not allow for inducible protein expression under ambient growth conditions. We have therefore optimized galactose-inducible expression of PfCRT in S. cerevisiae yeast. We find that expression of PfCRT confers CQ hypersensitivity to growing yeast and that this is due to plasma membrane localization of the transporter. We use quantitative analyses of growth rates to compare hypersensitivity for yeast expressing various PfCRT isoforms. We also report successful high level inducible expression of the P. vivax orthologue, PvCRT, and compare CQ hypersensitivity for PvCRT vs PfCRT expressing yeast. We test the hypothesis that hypersensitivity is due to increased transport of CQ into yeast expressing the transporters via direct (3)H-CQ transport experiments and analyze the effect that membrane potential has on transport. The data suggest important new tools for rapid functional screening of PfCRT and PvCRT isoforms and provide further evidence for a model wherein membrane potential promotes charged CQ transport by PfCRT. Data also support our previous conclusion that wild type PfCRT is capable of CQ transport and provide a basis for understanding the lack of correspondence between PvCRT mutations and resistance to CQ in the important malarial parasite P. vivax.
© 2011 American Chemical Society
Figures


Similar articles
-
Function of resistance conferring Plasmodium falciparum chloroquine resistance transporter isoforms.Biochemistry. 2013 Jun 18;52(24):4242-9. doi: 10.1021/bi400557x. Epub 2013 Jun 6. Biochemistry. 2013. PMID: 23688277 Free PMC article.
-
Analysis of Plasmodium vivax Chloroquine Resistance Transporter Mutant Isoforms.Biochemistry. 2017 Oct 17;56(41):5615-5622. doi: 10.1021/acs.biochem.7b00749. Epub 2017 Sep 26. Biochemistry. 2017. PMID: 28898049 Free PMC article.
-
Functional Comparison of 45 Naturally Occurring Isoforms of the Plasmodium falciparum Chloroquine Resistance Transporter (PfCRT).Biochemistry. 2015 Aug 18;54(32):5083-94. doi: 10.1021/acs.biochem.5b00412. Epub 2015 Aug 6. Biochemistry. 2015. PMID: 26208441 Free PMC article.
-
PfCRT-mediated drug transport in malarial parasites.Biochemistry. 2011 Jan 18;50(2):163-71. doi: 10.1021/bi101638n. Epub 2010 Dec 22. Biochemistry. 2011. PMID: 21142008 Free PMC article. Review.
-
Is PfCRT a channel or a carrier? Two competing models explaining chloroquine resistance in Plasmodium falciparum.Trends Parasitol. 2007 Jul;23(7):332-9. doi: 10.1016/j.pt.2007.04.013. Epub 2007 May 10. Trends Parasitol. 2007. PMID: 17493873 Review.
Cited by
-
Function of resistance conferring Plasmodium falciparum chloroquine resistance transporter isoforms.Biochemistry. 2013 Jun 18;52(24):4242-9. doi: 10.1021/bi400557x. Epub 2013 Jun 6. Biochemistry. 2013. PMID: 23688277 Free PMC article.
-
Identification and functional analysis of the primary pantothenate transporter, PfPAT, of the human malaria parasite Plasmodium falciparum.J Biol Chem. 2013 Jul 12;288(28):20558-67. doi: 10.1074/jbc.M113.482992. Epub 2013 May 31. J Biol Chem. 2013. PMID: 23729665 Free PMC article.
-
Functional characterization of the Plasmodium falciparum chloroquine-resistance transporter (PfCRT) in transformed Dictyostelium discoideum vesicles.PLoS One. 2012;7(6):e39569. doi: 10.1371/journal.pone.0039569. Epub 2012 Jun 19. PLoS One. 2012. PMID: 22724026 Free PMC article.
-
Structures of Plasmodium falciparum Chloroquine Resistance Transporter (PfCRT) Isoforms and Their Interactions with Chloroquine.Biochemistry. 2023 Mar 7;62(5):1093-1110. doi: 10.1021/acs.biochem.2c00669. Epub 2023 Feb 17. Biochemistry. 2023. PMID: 36800498 Free PMC article.
-
Deciphering the Resistance-Counteracting Functions of Ferroquine in Plasmodium falciparum-Infected Erythrocytes.ACS Med Chem Lett. 2012 Apr 13;3(6):480-3. doi: 10.1021/ml300062q. eCollection 2012 Jun 14. ACS Med Chem Lett. 2012. PMID: 24900498 Free PMC article.
References
-
- Fidock DA, Nomura T, Talley AK, Cooper RA, Dzekunov SM, Ferdig MT, Ursos LM, Sidhu AB, Naudé B, Deitsch KW, Su XZ, Wootton JC, Roepe PD, Wellems TE. Mutations in the P. falciparum digestive vacuole transmembrane protein PfCRT and evidence for their role in chloroquine resistance. Mol Cell. 2000;6:861–871. - PMC - PubMed
-
- Ferdig MT, Cooper RA, Mu J, Deng B, Joy DA, Su XZ, Wellems TE. Dissecting the loci of low-level quinine resistance in malaria parasites. Mol Microbiol. 2004;52:985–997. - PubMed
Publication types
MeSH terms
Substances
Grants and funding
LinkOut - more resources
Full Text Sources
Molecular Biology Databases
Research Materials
