. 2011 Aug;21(8):897-906.
doi: 10.1089/thy.2010.0457. Epub 2011 Jul 11.

The influence of thyroid-stimulating hormone and thyroid-stimulating hormone receptor antibodies on osteoclastogenesis

Affiliations

The influence of thyroid-stimulating hormone and thyroid-stimulating hormone receptor antibodies on osteoclastogenesis

Risheng Ma et al. Thyroid. 2011 Aug.

Abstract

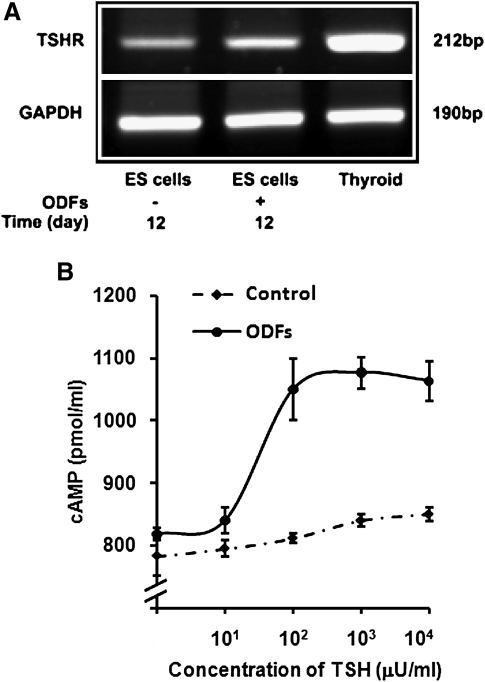
Background: We have shown that thyroid-stimulating hormone (TSH) has a direct inhibitory effect on osteoclastic bone resorption and that TSH receptor (TSHR) null mice display osteoporosis. To determine the stage of osteoclast development at which TSH may exert its effect, we examined the influence of TSH and agonist TSHR antibodies (TSHR-Ab) on osteoclast differentiation from murine embryonic stem (ES) cells to gain insight into bone remodeling in hyperthyroid Graves' disease.

Methods: Osteoclast differentiation was initiated in murine ES cell cultures through exposure to macrophage colony stimulation factor, receptor activator of nuclear factor кB ligand, vitamin D, and dexamethasone.

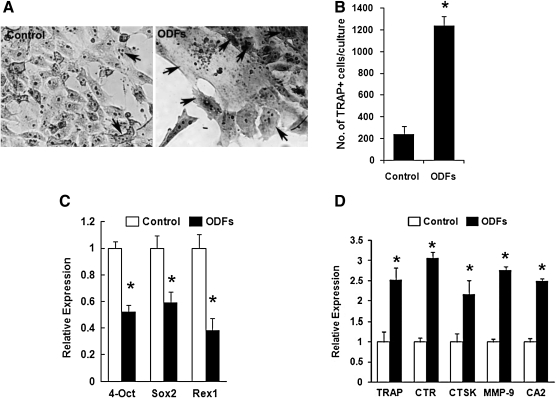
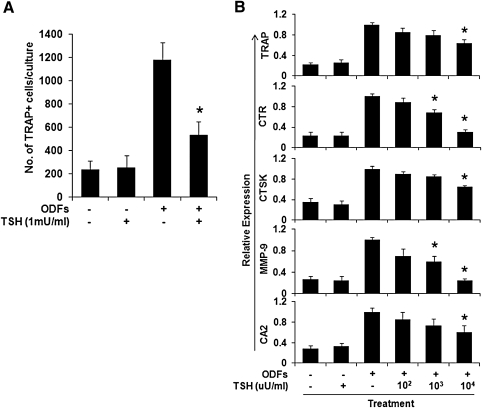
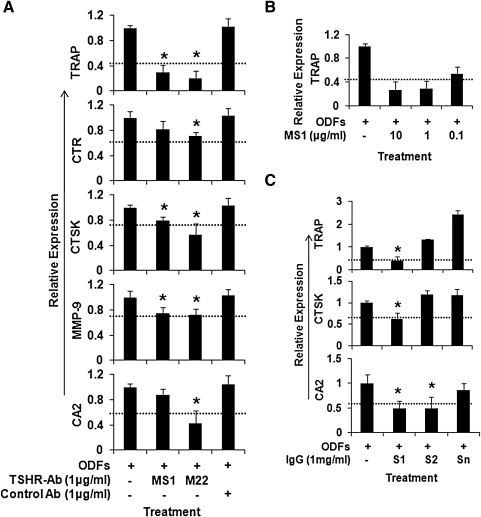
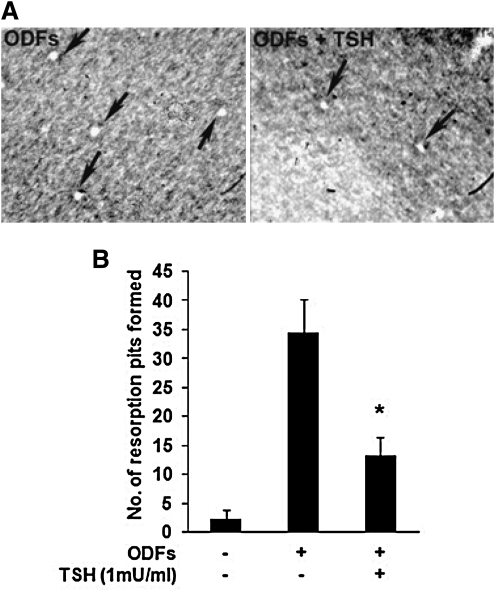
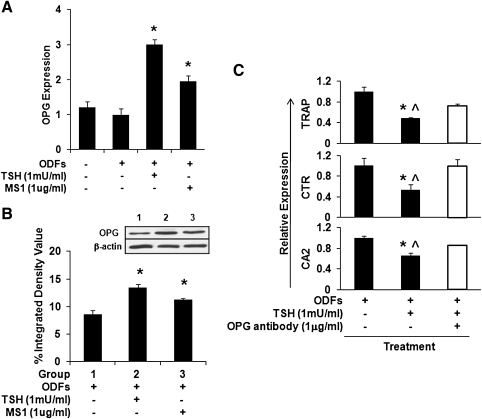
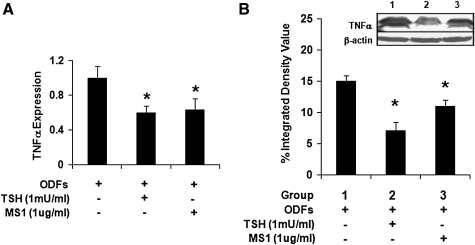
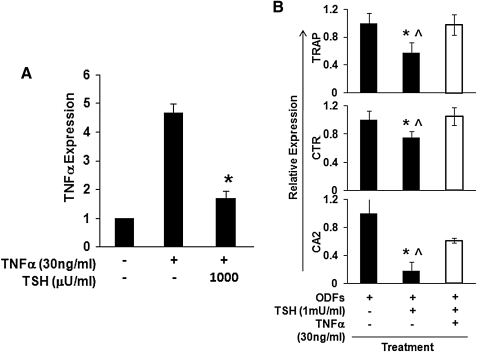
Results: Tartrate resistant acid phosphatase (TRAP)-positive osteoclasts formed in ~12 days. This coincided with the expected downregulation of known markers of self renewal and pluripotency (including Oct4, Sox2, and REX1). Both TSH and TSHR-Abs inhibited osteoclastogenesis as evidenced by decreased development of TRAP-positive cells (~40%-50% reduction, p = 0.0047), and by decreased expression, in a concentration-dependent manner, of osteoclast differentiation markers (including the calcitonin receptor, TRAP, cathepsin K, matrix metallo-proteinase-9, and carbonic anhydrase II). Similar data were obtained using serum immunoglobulin-Gs (IgGs) from patients with hyperthyroid Graves' disease and known TSHR-Abs. TSHR stimulators inhibited tumor necrosis factor-alpha mRNA and protein expression, but increased the expression of osteoprotegerin (OPG), an antiosteoclastogenic human soluble receptor activator of nuclear factor кB ligand receptor. Neutralizing antibody to OPG reversed the inhibitory effect of TSH on osteoclast differentiation evidencing that the TSH effect was at least in part mediated by increased OPG.

Conclusion: These data establish ES-derived osteoclastogenesis as an effective model system to study the regulation of osteoclast differentiation in early development. The results support the observations that TSH has a bone protective action by negatively regulating osteoclastogenesis. Further, our results implicate TSHR-Abs in offering skeletal protection in hyperthyroid Graves' disease, even in the face of high thyroid hormone and low TSH levels.


Figures

FIG. 1.
FIG. 1.
Osteoclast differentiation from murine ES cells using four ODFs. ES cells were cultured without (control) or with medium containing ODFs for 12 days, allowing the formation of osteoclasts. Cultured cells were fixed and then stained as described. (A) The cells stained for TRAP with enhanced intensity when cultured with ODFs (right panel) in contrast to control cells (left panel). Osteoclasts were multinucleated cells of various sizes (indicated by arrows). (B) The development of osteoclasts was measured as the increase in TRAP-positive multi-nucleated cells containing three or more nuclei, which were counted using grids placed in the ocular lens of the microscope. Three wells were measured in total for each experimental condition and results expressed as mean ± SEM of triplicate cultures (*p < 0.01). (C) Loss of stemness was assessed by real-time qPCR measurements for the expression of ES cell markers Oct4, Sox2, and REX1 in cells cultured with ODFs for 12 days. Undifferentiated ES cells were used as control. Significant differences were indicated by an asterisk (*p < 0.01). (D) Differentiation of osteoclasts was confirmed by real-time qPCR measurements for the transcriptional expression of osteoclast-specific markers, including TRAP, CTR, CTSK, MMP-9, and CA2, in the cultured cells without (filled clear) or with (filled black) ODFs. Significant differences were indicated by an asterisk (*p < 0.01). ES, embryonic stem; ODFs, osteoclast differentiated factors; TRAP, tartrate-resistant acid phosphatase; SEM, standard error of the mean; qPCR, quantitative polymerase chain reaction; CTSK, cathepsin K; MMP-9, matrix metallo-proteinase-9; CA2,carbonic anhydrase II; CTR, calcitonin receptor.
FIG. 2.
FIG. 2.
The effect of TSH on osteoclast differentiation. ES cells were cultured with the four ODFs for 12 days, allowing the formation of osteoclasts in the absence or presence of increasing concentrations of TSH as indicated. (A) TSH decreased the number of TRAP-positive multi-nucleated cells. TRAP-positive multi-nucleated cells containing three or more nuclei were counted. Three wells were counted in total for each condition and results expressed as mean ± SEM of triplicate cultures. (B) TSH decreased specific osteoclast markers in cultured cells. The cells were subjected to real-time qPCR analysis of TRAP, CTR, CTSK, MMP-9, and CA2 gene expression. Values were normalized to GAPDH RNA expression. TSH showed a dose-dependent decrease in all osteoclast markers. The results are representative of three independent experiments. *The p-value comparing ODFs treatment versus ODFs treatment in the presence of TSH was < 0.01. TSH, thyroid-stimulating hormone; GAPDH, glyceraldehyde-3-phosphate dehydrogenase.
FIG. 3.
FIG. 3.
The effects of TSHR-Ab or Graves' Disease IgG on the differential expression of osteoclast markers. (A) Stimulating TSHR-Abs inhibit osteoclast marker expression. The effects of monoclonal TSHR-Abs MS1 and M22 (1 μg/mL) on osteoclast markers in cultured ES cells with ODFs are illustrated. There was a marked decrease in all osteoclast markers with MS1 and M22 treatment, whereas this decrease was not observed with control antibody (*p < 0.01). (B) The transcription of osteoclast gene markers, TRAP, measured by qPCR, was decreased by MS-1 in a dose-dependent manner. (C) Serum IgG from two patients with Graves' disease and TSHR-Abs decreased specific osteoclast gene expression. Sample S1 clearly inhibited TRAP, CTSK, and CA2, whereas S2 was less effective. The normal control IgG (Sn) showed no inhibition. The p-value comparing ODFs treatment versus ODFs treatment in the presence of IgG fractions was < 0.01. The dashed line in all the panels indicates the inhibition caused by TSH at 1 mU/mL within the same experiment. These data are typical of three independent experiments. TSHR-Ab, TSH receptor antibody; IgG, immunoglobulin-G.
FIG. 4.
FIG. 4.
Effects of TSH on the resorption activity of osteoclasts from ES cells cultured with four ODFs. ES cells were cultured on calcium-phosphate apatite-coated plates with or without ODFs in the absence or presence of TSH (1 mU/mL) for 12 days. When TRAP-positive osteoclasts appeared, the cells were removed with a solution of 5% sodium hypochlorite and pits (clear areas) were counted microscopically. (A) Resorbed lacunae (arrows) on the plates were photographed under an inverted microscope ( × 200). Note that compared with ODFs treatment, TSH (1 mU/mL) significantly decreased the resorption activity of osteoclasts. (B) The number of resorption pits in TSH− and TSH+ cultures was determined by light microscopy in five randomly chosen fields. Data are presented as mean ± SEM of triplicate cultures. The p-value, calculated by comparing ODFs treatment versus ODFs treatment in the presence of TSH, was < 0.01.
FIG. 5.
FIG. 5.
Expression of TSHR in osteoclasts differentiated from ES cells. (A) Reverse transcription–PCR provided evidence for TSHR expression in osteoclast cultures from ES cells incubated without or with four ODFs for 12 days. Undifferentiated ES cells and mouse thyroid cells were used as negative and positive controls. (B) TSH induced dose-dependent cAMP generation in ODF-cultured ES cells. The ES cells were cultured with ODFs for 12 days and intracellular cAMP levels were measured by enzyme-immunoassay. Control cells were undifferentiated ES cells. TSH treatment of ODF cultured cells lead to a low level dose-dependent induction of cAMP. Non-ODF-treated ES cells showed only a minimal response. Chinese hamster ovary cells expressing wild-type human TSHR (JPO9 cells) (18) were used as a positive control (not illustrated). cAMP, cyclic adenosine monophosphate.
FIG. 6.
FIG. 6.
Expression of OPG levels in differentiated ES cell cultures. All cells were cultured with four ODFs for 12 days. (A) Real-time PCR analysis of OPG mRNA levels in the cultured cells with ODFs in the presence of TSH or TSHR stimulating antibody MS1 as indicated. TSH or MS1 antibody increased the gene expression of OPG in the ODF-treated ES cells. Values were normalized to GAPDH RNA expression. The results are representative of three independent experiments. Significant differences were indicated by an asterisk (*p < 0.01) comparing ODFs treatment versus ODFs treatment in the presence of TSH or MS1 antibody. (B) Total lysates were subjected to Western blot analysis for detection of OPG using anti-OPG (1 μg/mL) (inset). β-actin served as a control. There was a significant induction of OPG with TSH or MS1 treatment. Significant differences were indicated by an asterisk (*p < 0.01) comparing ODFs treatment versus ODFs treatment in the presence of TSH or MS1 antibody. (C) Attenuation of osteoclast markers by neutralizing antibody to OPG on the TSH treated cells. mRNA expression levels were analyzed by real-time qPCR in the absence or presence of TSH and neutralize OPG antibody as indicated. Anti OPG treatment reversed the suppression of TSH on the osteoclast markers. The p-value was calculated comparing ODFs treatment versus ODFs treatment in the presence of TSH (*p < 0.01) or ODFs treatment in the presence of TSH and OPG antibody (^p  < 0.01). OPG, osteoprotegerin.
FIG. 7.
FIG. 7.
Expression of TNFα in differentiated ES cell cultures. (A) Real-time PCR analysis of TNFα mRNA levels in the cultured cells with ODFs in the presence of TSH and MS1 antibody. Values were normalized to GAPDH RNA expression. The results are representative of three independent experiments. Significant differences were indicated by an asterisk (*p < 0.01) comparing ODFs treatment versus ODFs treatment in the presence of TSH or MS1 antibody. (B) Total lysates were subjected to western blot analysis for detection of the TNFα isoforms. TNFα expression was decreased by the presence of TSH or MS1 antibody (inset). Densitometric evaluation of both isoforms in this immunoblot also illustrates the inhibition of TNFα (*p < 0.01). TNFα, tumor necrosis factor-alpha.
FIG. 8.
FIG. 8.
Modulation of TNF and osteoclast markers. (A) Undifferentiated ES cells were cultured with four ODFs for 12 days and stimulated with TNFα (30 ng/mL) in the presence or absence of increasing doses of TSH for 2 hours. TNFα expression levels were measured by real-time qPCR. TSH decreased TNFα expression levels induced by recombinant TNFα in a dose-dependent manner. Values were normalized to GAPDH RNA expression. The results are representative of three independent sets of similar experiments. *p < 0.01 comparing between ODFs treatment in the presence of TNFα and ODFs treatment in the presence of TNFα and TSH. (B) Attenuation of osteoclast markers by recombinant TNFα in the presence of TSH. mRNA expression levels were analyzed by real-time qPCR after 12 days osteoclast differentiation from ES cells with ODFs in presence of TSH alone or TNFα (30 ng/mL) plus TSH. As indicated in this graph, TNFα reversed the suppression of osteoclast markers induced by TSH alone. Values were normalized to GAPDH RNA expression. The results are representative of at least three independent sets of similar experiments. The p-value comparing ODFs treatment versus ODFs treatment in the presence of TSH (*p < 0.01) or ODFs treatment in the presence of TSH and recombinant TNFα (^p < 0.01).

References

    1. Ross DS. Hyperthyroidism, thyroid hormone therapy, and bone. Thyroid. 1994;4:319–326. - PubMed
    1. Biondi B. Cooper DS. The clinical significance of subclinical thyroid dysfunction. Endocr Rev. 2008;29:76–131. - PubMed
    1. Zaidi M. Davies TF. Zallone A. Blair HC. Iqbal J. Moonga SS. Mechanick J. Sun L. Thyroid-stimulating hormone, thyroid hormones, and bone loss. Curr Osteoporos Rep. 2009;7:47–52. - PubMed
    1. Kim BJ. Lee SH. Bae SJ. Kim HK. Choe JW. Kim HY. Koh JM. Kim GS. The association between serum thyrotropin (TSH) levels and bone mineral density in healthy euthyroid men. Clin Endocrinol (Oxf) 2010;73:396–403. - PubMed
    1. Mazziotti G. Porcelli T. Patelli I. Vescovi PP. Giustina A. Serum TSH values and risk of vertebral fractures in euthyroid post-menopausal women with low bone mineral density. Bone. 2010;46:747–751. - PubMed

Publication types

LinkOut - more resources