. 2011 Oct;11(7):415-26.
doi: 10.1016/j.gep.2011.06.004. Epub 2011 Jul 2.

A BAC transgenic Hes1-EGFP reporter reveals novel expression domains in mouse embryos

Affiliations

A BAC transgenic Hes1-EGFP reporter reveals novel expression domains in mouse embryos

Rasmus Klinck et al. Gene Expr Patterns. 2011 Oct.

Abstract

Expression of the basic helix-loop-helix factor Hairy and Enhancer of Split-1 (Hes1) is required for normal development of a number of tissues during embryonic development. Depending on context, Hes1 may act as a Notch signalling effector which promotes the undifferentiated and proliferative state of progenitor cells, but increasing evidence also points to Notch independent regulation of Hes1 expression. Here we use high resolution confocal scanning of EGFP in a novel BAC transgenic mouse reporter line, Tg(Hes1-EGFP)(1Hri), to analyse Hes1 expression from embryonic day 7.0 (e7.0). Our data recapitulates some previous observations on Hes1 expression and suggests new, hitherto unrecognised expression domains including expression in the definitive endoderm at early somite stages before gut tube closure and thus preceding organogenesis. This mouse line will be a valuable tool for studies addressing the role of Hes1 in a number of different research areas including organ specification, development and regeneration.


Figures

Figure 1
Figure 1
The whole BAC Hes1-EGFP sequence is inserted in the genome of the Tg(Hes1-EGFP)1Hri mouse strain. (A) The BAC Hes1-EGFP construct encompasses more than 224 kb of chromosome 16 from base pair number 29887283 to 30111596. This fragment includes the Hes1gene with the four exons shown as black boxes. EGFP shown in green is inserted in the 5′UTR. Restriction enzymes and the two probes for Southern blot verification of insertion of the BAC Hes1-EGFP ends are indicated (B) Southern blot on genomic DNA from wild-type, heterozygous, and homozygous Hes1-EGFP mice as indicated on the lanes, digested with BglII and EcoRV and hybridised with Probe1. The blot reveals the expected 6023 bp wild-type band in all three mice and a BAC Hes1-EGFP specific band around 4 kb in the transgenic mice. (C) Southern blot on genomic DNA from wild-type, heterozygous, and homozygous Hes1-EGFP mice as indicated on the lanes, digested with NdeI and hybridised with Probe2. The blot reveals the expected 4222 bp wild-type band in all three mice and BAC Hes1-EGFP specific bands of approximately 9 kb and 11 kb in the transgenic mice. (D) Hes1 immunofluorescence in the inner and outer layer of the optic cup at e10.5. (E) EGFP immunofluorescence on the adjacent section to D. (F) Hes1 immunofluorescence in the dorsal pancreas tissue at e10.5. (G) EGFP immunofluorescence on the adjacent section to G. (H) Hes1 immunofluorescence in the neural tube at e14.5. (I) EGFP immunofluorescence on the adjacent section to H. (J) Hes1 immunofluorescence in the oesophagus at e14.5. (K) EGFP immunofluorescence on the adjacent section to J. il, inner layer of optic cup; ol, outer layer of optic cup; dp, dorsal pancreas; d, duodenum; cc, central canal; rp, roof plate; el, ependymal layer; oe, oesophagus. Dorsal is towards the top. Scale bars are 50μm.
Figure 2
Figure 2
Hes1 is expressed in the endoderm at late primitive streak stage and in the endoderm, presomitic mesoderm, and neuroepithelium in e8.0 mouse embryos. (A) Whole mount immunostaining for EGFP in an e7.0 embryo of the Hes1-EGFP mouse strain. The endodermal cell layer is positive for EGFP expression. (B) An optical section of the embryo in A showing that it is only the endodermal cells and not the mesoderm nor the ectoderm that express EGFP. (C) Whole mount immunostaining of a 6 somite (e8.0) embryo of the Hes1-EGFP mouse strain. EGFP is in green and the endoderm marker Sox17 is in red. Posterior is to the left and anterior is to the right. It shows the area of strong EGFP expression in the posterior part of the embryo as well as the anterior expression area at the anterior intestinal portal (AIP). (D) An optical section of another e8.0 embryo showing a ventral view of the strong EGFP fluorescence in the neuroepithelium posterior to the forming somites. (E, E’,E”) An optical cross section of the embryo in C showing the EGFP fluorescence in the endodermal cell layer (E), marked by nuclear Sox17 expression in red (E’), and a merged image (E”). The epithelial marker E-cadherin is in blue. Posterior endodermal EGFP expression is detected from the 4th somite pair to the tip of the tail. (F) A whole mount image stack of an 8 somite embryo showing a more explicit EGFP expression in the posterior endoderm marked by Sox17 in red (arrowheads). (G) A higher magnification subset stack of the embryo in F showing more details of the posterior EGFP expression area. (H) An optical section from the image stack in G showing the EGFP fluorescence in the endodermal cell layer with an anterior border at the 4th somite pair (arrow). Also the expression in the neuroepithelium posterior to the forming somites is shown. (I, I’, I”) An optical section of the embryo in F showing the EGFP fluorescence in the endodermal cell layer (I), marked by nuclear Sox17 expression in red (I’), and a merged image (I”). The epithelial marker E-cadherin is in blue. (J, J’, J”) Another optical section of the embryo in F showing the EGFP fluorescence in the presomitic paraxial mesoderm (J), adjacent to the endodermal Sox17 expression in red (J’), and a merged image (J”). The epithelial marker E-cadherin is in blue. (K) A high magnification image stack showing the anterior expression area in the foregut endoderm and the AIP of the embryo in F. (L) A high magnification image stack showing the anterior expression area in the foregut endoderm and the AIP of the embryo in C. (M) An optical cross section from the image stack in L showing the EGFP expression in the foregut epithelium. The epithelial marker E-cadherin is in blue. nt: neural tube; nf: neural fold; fg: foregut; h: primitive heart. Scale bars are 100μm.
Figure 3
Figure 3
Whole embryo overview of the Hes1-EGFP expression from e9.0 to e10.5. (A) Whole mount immunostaining of an e9.0 embryo (17 somite pairs) showing EGFP expression in green and the pancreatic progenitor cell marker Pdx1 in red. EGFP expression is seen in the dorsal pancreatic primordium (dp) with a clear anterior border of expression indicated by the dashed line. There is also EGFP expression in the ventral foregut endoderm (fg) but not in the ventral pancreatic primordium (vp). EGFP expression is also seen in the dorsal part of the gut tube posterior to the pancreas area, in the mesonephric ridge (mr), and in the presomitic mesoderm (psm). Moreover, EGFP expression is observed in the branchial arches (b), the pharyngeal region (ph), the otic pit (o), and optic vesicle (op). EGFP expression is also detected in the frontonasal process (fp) and the neuroepithelium of forebrain, midbrain, and hindbrain. Scale bar is 100μm. (B) Cross sectional view of the tail bud at e9.0 (17 somite pairs) showing EGFP expression in neural tube (nt) and psm, but also in the notochord (n) and the dorsal endoderm of the posterior hindgut (hg). Co-immunostaining for the epithelial cell marker E-cadherin is in blue. Scale bar is 100μm. (C, D) Whole mount immunostaining at e9.5 (20 somite pairs in C, 26 somite pairs in D) showing EGFP expression in the dorsal pancreas. Scale bars are 200μm. (E) Whole mount immunostaining at e10.5 showing EGFP expression in green and the epithelial cell marker E-cadherin in blue. EGFP expression is seen in the mesonephric tubules (m), dorsal pancreatic bud (dp), retina (r), the tail bud, the telencephalic vesicle (t), and the neuroepithelium of midbrain (m), hindbrain (h), ventricular zone (vz), and dorsal neural tube. Scale bar is 500μm. (F, F’) Higher magnification images of the pancreas and mesonephros of the e10.5 embryo shown in E. Co-staining for Pdx1 is shown in red. (F’, inset) The ventral bud of the pancreas (vp) is also positive for EGFP expression when analysed at a higher magnification. Scale bars are 200μm and 50μm in inset. (G) Cross sectional view of the tail bud at e10.5 showing EGFP expression in the notochord (n) and posterior hindgut (hg), but also in the mesoderm and the neural tube (nt). Scale bar is 100μm.
Figure 4
Figure 4
Hes1 promoter activity at different stages in the developing pancreas. Cross sections of mouse pancreas at embryonic days e10.5 (A, D), e12.5 (B, C, E, F), e14.5 (G, K, O), e17.5 (H, L, P), neonatal P0 (I, M, U), postnatal P8 (J, N, V), and one year old adult (X) all stained by immunofluorescence for EGFP expression shown in green. (A, B, G-J) Co-stainings for Pdx1 expression shown in red and insulin expression shown in blue. (D, E, K-N) Co-stainings for Pdx1 expression shown in red and glucagon expression shown in blue. (C) Co-staining for Pdx1 expression shown in red. (F) Co-staining for Carboxypeptidase A (Cpa1) expression shown in red. (A, D) EGFP is detected throughout both the dorsal (dp) and the ventral (vp) pancreatic epithelium at e10.5. There is no EGFP in the surrounding pancreatic mesenchyme, while the mesenchyme around the duodenum (d) contains scattered EGFP positive cells (arrow heads). (B, E) EGFP-expression is seen in the majority of the e12.5 pancreatic epithelium, but also Pdx1-negative cells can be found that express EGFP. Cells expressing insulin and glucagon are often negative for EGFP (arrow heads), but we also find EGFP to be co-expressed with the hormones (arrow). (C) In the e12.5 tips of the branching structures, EGFP is only expressed in some of the cells. (F) Cpa1 is expressed in the branching tip cells which have very low amounts or no EGFP (small arrow heads). (G, K, O) At e14.5, the entire central epithelium shows strong EGFP expression whereas the branching tips are completely negative for EGFP. Insulin and glucagon positive cells are also negative for EGFP. (H, L, P) At e17.5, EGFP expression is found as large clusters in connection with regions of developing endocrine cells in the central areas of the tissue. In the developing exocrine part, small clusters of 2-3 cells or single cells that co-express EGFP and Sox9 are observed. (I, M, U) In neonatal pancreas tissue (P0), EGFP is detected in and around the ducts and the islets of Langerhans but never overlapping with neither insulin nor glucagon. Single EGFP positive cells are often seen in the centre of the acini (arrow heads). (J, N, V) Eight days after birth (P8), the islets are completely devoid of EGFP expression. However, the scattered EGFP positive single cells among the exocrine cells remain (arrow heads) and they co-express Sox9 (inset). (X) Very rarely, EGFP positive single cells among the exocrine cells can be found in adult pancreas tissue (arrow heads). They co-express Sox9 (inset). Scale bars are 50 μm.
Figure 5
Figure 5
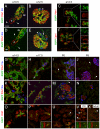
Hes1 promoter activity in the developing duodenum. (A) Whole mount immunostaining showing the duodenal region in a lateral view of an e10.5 embryo. E-cadherin (Cdh1) staining in blue outlines the epithelium, and staining for EGFP is in green. The dorsal (dp) and ventral (vp) pancreas epithelia are EGFP positive as well as scattered cells in the duodenal mesenchyme (arrow heads). d: duodenum; gb: gall bladder. (B) Cross section of e10.5 duodenum (d) showing the scattered EGFP positive cells in the surrounding mesenchyme (arrow heads), but also some EGFP in the dorsal epithelium. (C-F) Cross sections of e12.5 duodenum. (C) Shows a layer of green EGFP positive cells at the periphery of the mesenchyme. Immunostaining for smooth muscle actin (SMA) in red labels the smooth muscle cells and Cdh1 in blue outlines the epithelium. (D) Immunostaining for the neuronal marker β-III-tubulin in red on the adjacent section to (C) shows overlapping expression with EGFP in the enteric neurons. (E, F) Immunostaining for SMA in red and EGFP in green in duodenum in an e12.5 Hes1-EGFP transgenic embryo (E) and a wild-type littermate (F) showing that the EGFP signal in the enteric neurons is not background fluorescence. (G) At e14.5 there are EGFP positive cells appearing in the duodenal epithelium and in the mesenchyme there is strong EGFP expression in a cell layer in the outer periphery and a weaker EGFP signal in the mesenchyme closer to the epithelium. (H) In e17.5 duodenum, EGFP in green is detectable in the epithelium but no longer in the mesenchyme. (I) Staining for EGFP expression in green shows continued Hes1 promoter activity in the epithelium at P0. (J) At P8, the EGFP expression is less abundant but still found in the epithelium and primarily seen in the crypts. (K, L) In one year old adult tissue, a crypt is occasionally found to express EGFP (K), or there are regions with EGFP expression along the villi (L). In all panels (G-K), EGFP expression is in green and the epithelium is outlined by Cdh1 staining in red. Panel (L) shows a co-staining of EGFP in green with Sox9 positive crypt cells in red. Scale bars are 50 μm in A-F and 100 μm in G-L.
Figure 6
Figure 6
Hes1-promotor activity in the developing liver. (A, A’, A”) Optical section from a whole mount immunostaining of an e9.0 embryo (17 somite pairs) showing EGFP expression in the dorsal pancreas (dp) and the ventral foregut (fg) in (A), expression of Prox1 in the dp and the liver liverticulum (ld) in (A’), and the merged image in (A”). Scale bar is 100 μm. (B, C) Cross sections of e9.0 primitive gut at (B) the most anterior part of the liver diverticulum (ld), and (C) through the middle of the ld. EGFP expression co-localise with Prox1 in the dp but there is no detectable EGFP in the Prox1 positive developing liver cells. Scale bars are 100 μm. (D, E) Adjacent sections of e10.5 liver bud (lb) showing (D) Hnf4a expression in the hepatoblasts (hb) and (E) Sox9 in the liver bud epithelium. EGFP is expressed together with Sox9 in the dorsal pancreas (dp) but not in the developing liver tissue. (F, G) e12.5 and e14.5 common bile duct (cbd) epithelium co-express Sox9 and EGFP. (H) Two Sox9 positive neighbouring cells along the e12.5 portal vein (pv). One of the two cells is also expresses EGFP. (I) At e14.5, many cells along the portal veins co-express EGFP and Sox9. (J, K) At e17.5 and P0, most of the biliary epithelium co-express EGFP and Sox9. (L, M) There are many EGFP positive cells along the portal veins at P8, but regarding the bile ducts there are two different observations where (L) shows an asymmetrical bile duct with EGFP expression in half of the epithelium and (M) shows a bile duct with no EGFP expression. (N) In adult (one year old) liver, we have not found any EGFP positive cells. Scale bars are 50 μm in (D-N). Asterisks mark the lumen of the bile ducts.
Figure 7
Figure 7
Hes1-promotor activity in the developing kidneys. (A) Whole mount immunostaining showing the mesonephros in a lateral view of an e10.5 embryo. Hes1 promoter-driven EGFP in green is seen in the mesonephric tubules (mt) but not in the mesonephric ducts (md). Staining for E-cadherin in red outlines the epithelium. (B) Cross section of e12.5 metanephros showing persistent EGFP expression in the tubules. Co-staining for E-cadherin is shown in red. (C) Cross section of e14.5 metanephros shows EGFP expression in all the epithelialized derivatives of the metanephric mesenchyme. Co-staining for E-cadherin is shown in red. (D, D’, E, E’) Cross sections at e17.5 and P0 show that there is EGFP expression in stage I-III nephrons in the cortical region and in collecting ducts and mesenchymal cells in the medullary region. (F, F’) Cross section at P8 shows EGFP expression in cells only in the medullary interstitium. Scale bars in (A-C) are 50μm. Scale bars in (D-F) are 100 μm.
Figure 8
Figure 8
Hes1-promotor activity in the developing lungs. (A) Cross section showing a weak EGFP immunoreactivity (green) in the main bronchus (mb) epithelium of the e12.5 lung bud (arrow), but no EGFP expression in the segmental bronchus (sb) epithelium marked in red by Sox9 co-immunostaining. Cdh1 marks the epithelium in blue. oe, oesophagus. (B) Cross section of e14.5 developing lung tissue shows EGFP expression in green in the epithelium of the primary bronchus. (C) e17.5 cross section showing EGFP immunostaining in the epithelium of the bronchioles. (D, E, F) Cross sections of P0, P8, and adult lung tissue showing persistent EGFP immunoreactivity in the epithelia of the central bronchioles. Scale bars are 50μm.

Similar articles

Cited by

References

    1. Ahnfelt-Ronne J, Jorgensen MC, Hald J, Madsen OD, Serup P, Hecksher-Sorensen J. An improved method for three-dimensional reconstruction of protein expression patterns in intact mouse and chicken embryos and organs. J Histochem Cytochem. 2007;55:925–930. - PubMed
    1. Antoniou A, Raynaud P, Cordi S, Zong Y, Tronche F, Stanger BZ, Jacquemin P, Pierreux CE, Clotman F, Lemaigre FP. Intrahepatic bile ducts develop according to a new mode of tubulogenesis regulated by the transcription factor SOX9. Gastroenterology. 2009;136:2325–2333. - PMC - PubMed
    1. Apelqvist A, Li H, Sommer L, Beatus P, Anderson DJ, Honjo T, Hrabe de Angelis M, Lendahl U, Edlund H. Notch signalling controls pancreatic cell differentiation. Nature. 1999;400:877–881. - PubMed
    1. Burke Z, Oliver G. Prox1 is an early specific marker for the developing liver and pancreas in the mammalian foregut endoderm. Mech Dev. 2002;118:147–155. - PubMed
    1. Chen L, Al-Awqati Q. Segmental expression of Notch and Hairy genes in nephrogenesis. Am J Physiol Renal Physiol. 2005;288:F939–952. - PubMed

Publication types

MeSH terms

Substances

LinkOut - more resources