. 2011 Jul 14;71(1):61-75.
doi: 10.1016/j.neuron.2011.05.029.

Ank3-dependent SVZ niche assembly is required for the continued production of new neurons

Affiliations

Ank3-dependent SVZ niche assembly is required for the continued production of new neurons

Patricia Paez-Gonzalez et al. Neuron. .

Abstract

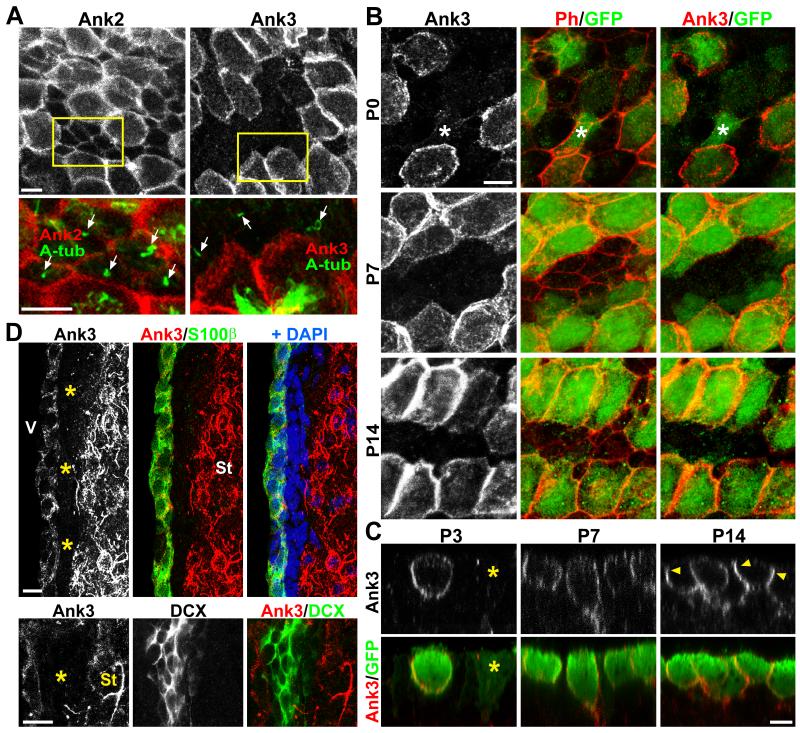
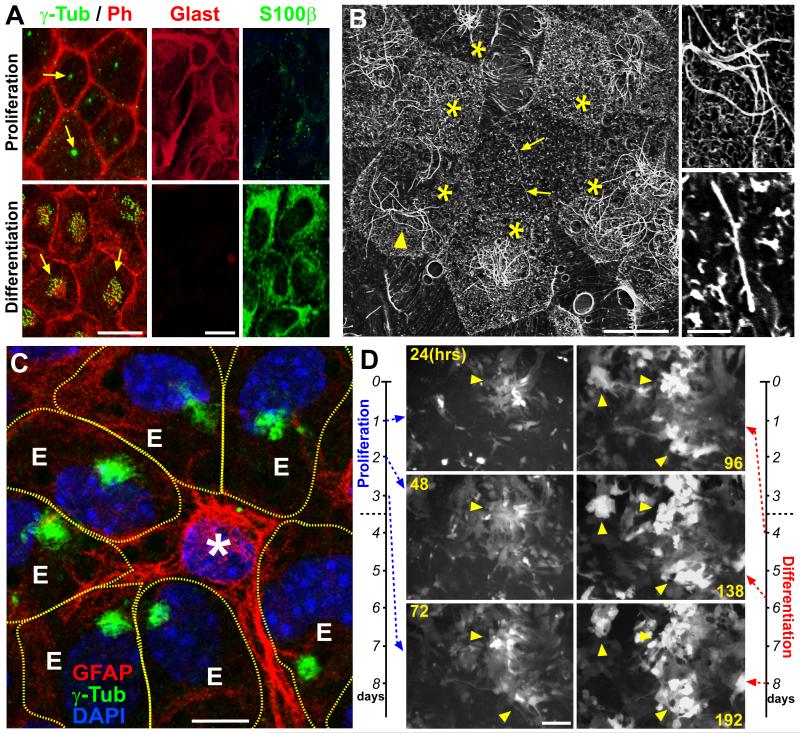
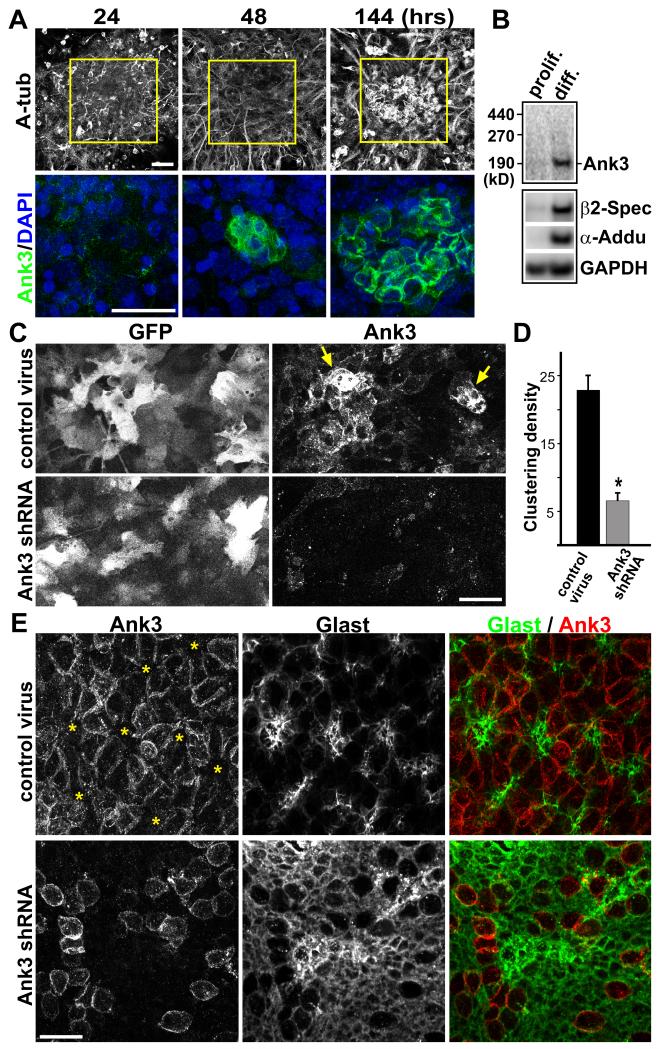
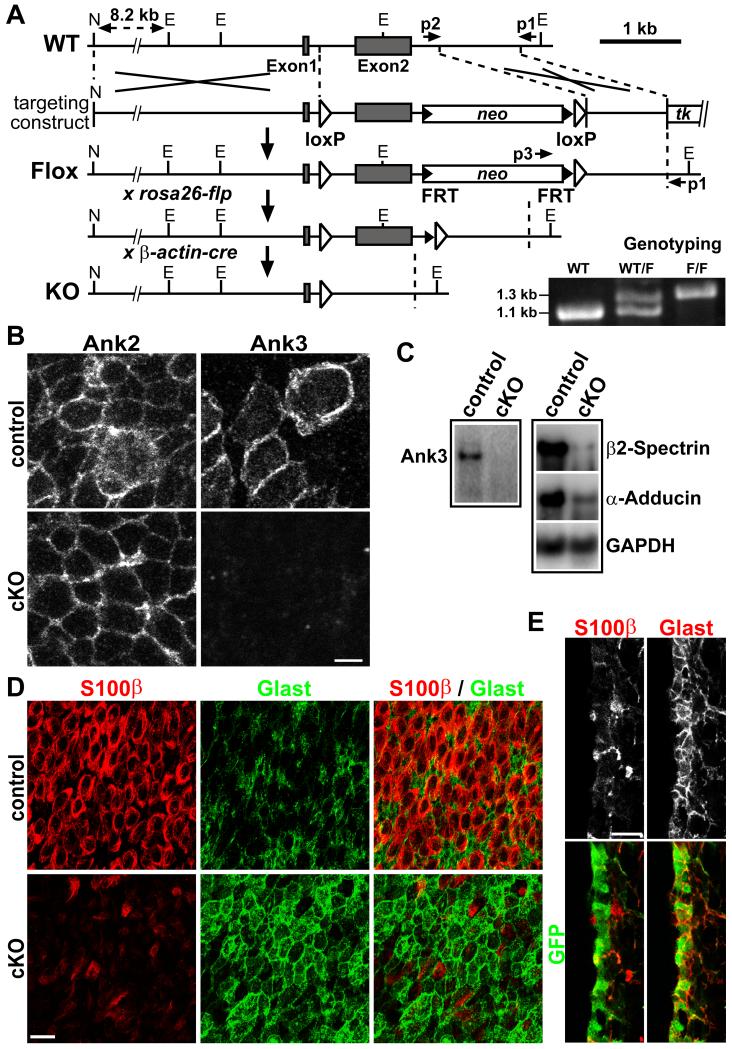
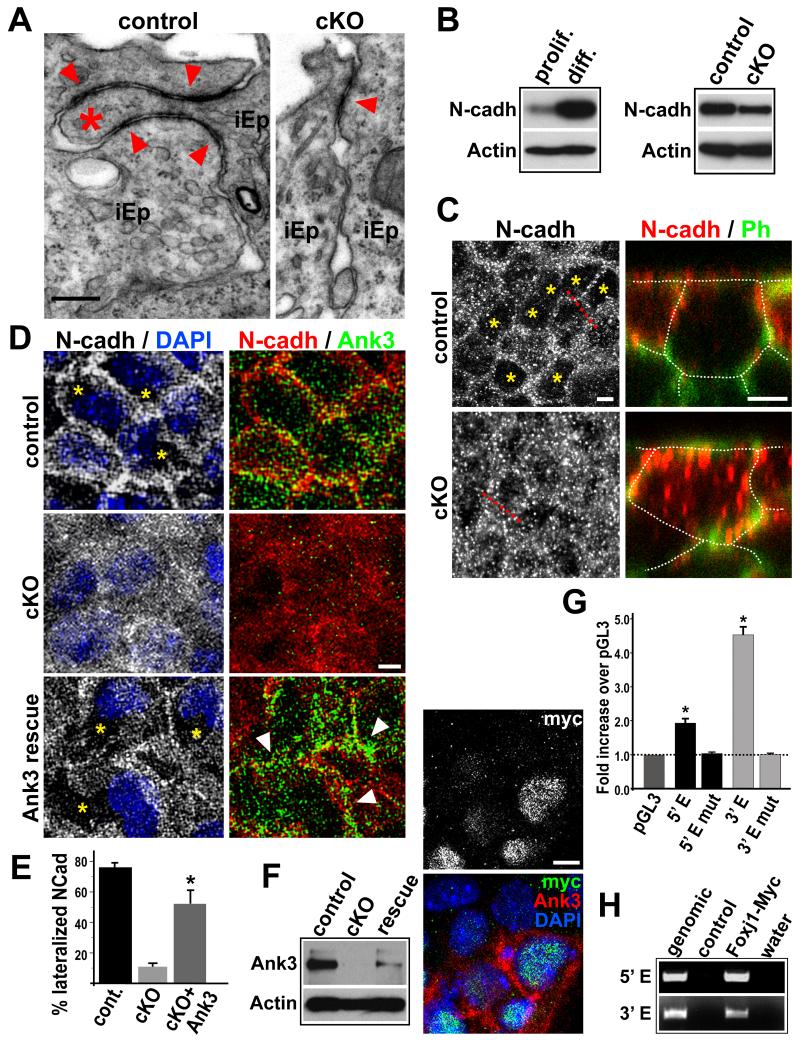
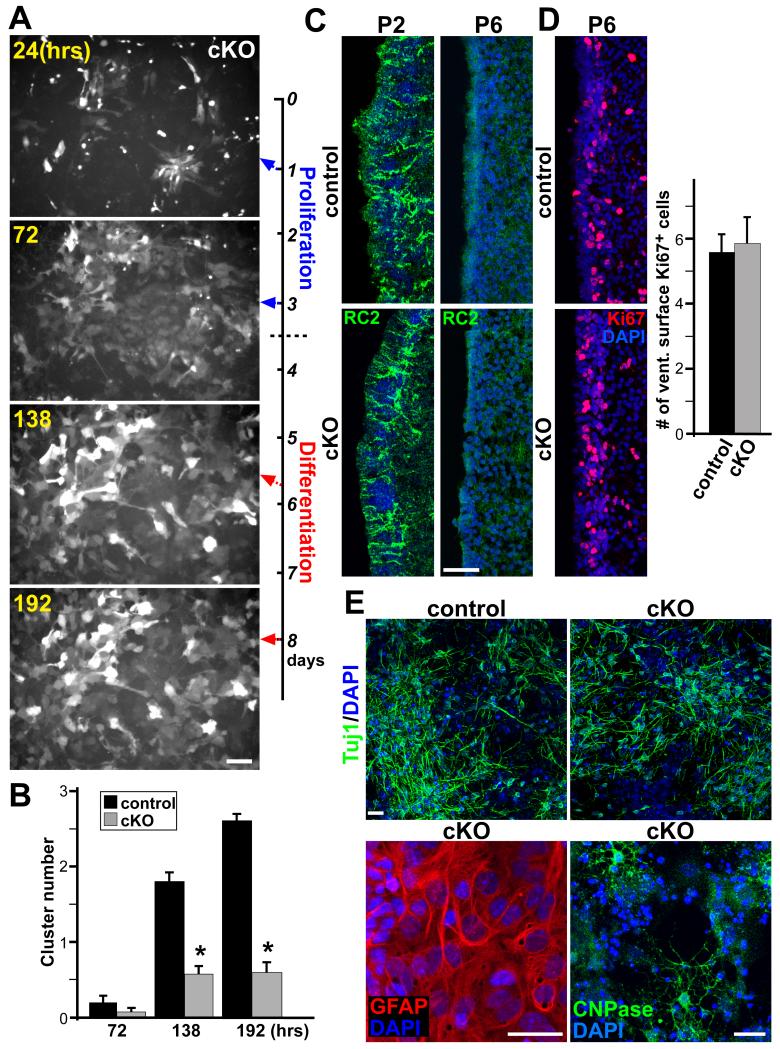
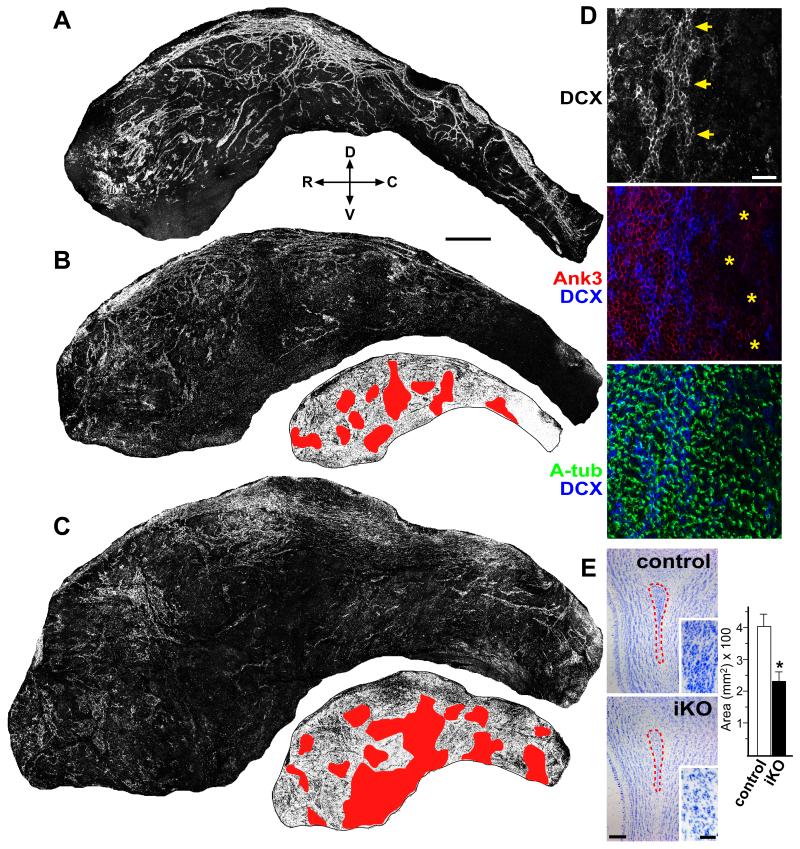
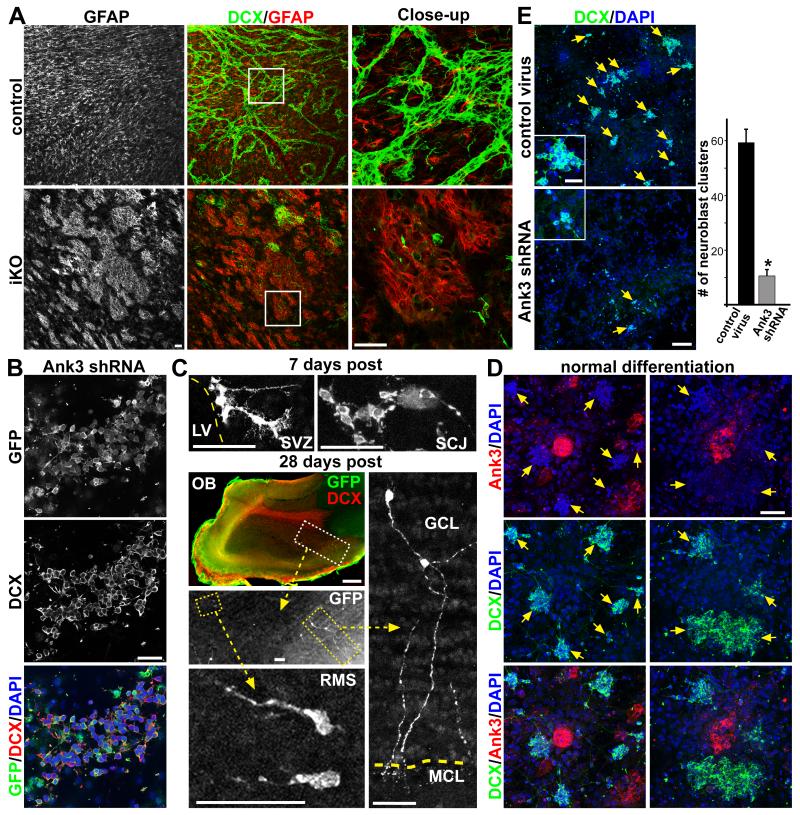
The rodent subventricular/subependymal zone (SVZ/SEZ) houses neural stem cells (NSCs) that generate olfactory bulb interneurons. It is unclear how the SVZ environment sustains neuronal production into adulthood. We discovered that the adapter molecule Ankyrin-3 (Ank3) is specifically upregulated in ventricular progenitors destined to become ependymal cells, but not in NSCs, and is required for SVZ niche assembly through progenitor lateral adhesion. Furthermore, we found that Ank3 expression is controlled by Foxj1, a transcriptional regulator of multicilia formation, and genetic deletion of this pathway led to complete loss of SVZ niche structure. Interestingly, radial glia continued to transition into postnatal NSCs without this niche. However, inducible deletion of Foxj1-Ank3 from mature SVZ ependyma resulted in dramatic depletion of neurogenesis. Targeting a pathway regulating ependymal organization/assembly and showing its requirement for new neuron production, our results have important implications for environmental control of adult neurogenesis and harvesting NSCs for replacement therapy.


Figures

Figure 1
Figure 1. Ank3 expression in SVZ neurogenic niche
(A) IHC staining of P14 lateral ventricular wall wholemounts showing the specificity of Ank3 expression in multiciliated ependymal cells, but not monociliated cells (arrows). (B) Ank3 and GFP staining of brain lateral ventricular wall wholemounts from P0, P7, and P14 Foxj1-GFP transgenic mice. At P0, there were GFP+ pRGPs (smaller ventricular surface area) with low Ank3 expression (*). Ph = Phalloidin. (C) IHC staining of ventricular wall wholemounts in x-z plane, showing upregulation/lateral organization of Ank3 in Foxj1-GFP+ pRGPs during postnatal maturation (arrowheads). Note that GFP-dim cells at P3 did not have high Ank3 levels (*). (D) P14 coronal sections of SVZ stained with Ank3, S100β, DCX, DAPI, showing little to no Ank3 expression in DCX+ neuroblasts and SVZ beneath the ependyma (*). V: ventricle; St: striatum. Scale bar: (A – C) 5 μm, (D) 10 μm. See also Figure S1.
Figure 2
Figure 2. In vitro generation of SVZ ependymal clusters
(A) IHC staining of in vitro cultured pRGPs from P0 mice under proliferating (3 days after plating, upper row) and differentiating conditions (10 days after plating, bottom row). Note γ-Tubulin (γ-Tub) staining showing single basal body during proliferation (arrows, corresponding to monociliated cells), and multiple basal bodies per cell after differentiation (arrows, corresponding to multiciliated cells). (B) Scanning electron microscopic (SEM) images of differentiated pRGPs showing multiciliated ependymal cells (ECs, *) arranged in clusters around monociliated cells (arrows). Right panels show higher magnification view of multiciliated cell (arrowhead), and monociliated cells (arrows). (C) IHC staining of ependymal clusters. Monociliated cell in the center is GFAP+ (*). Multiciliated ependymal cells show clustered γ-Tub staining (E), and their cell borders are represented by dash lines (traced from Phalloidin co-staining). (D) Stills from real-time live imaging movie of Foxj1-GFP+ pRGPs showing proliferation and differentiation of SVZ progenitors. Note the increase in GFP+ cell clustering during proliferation/differentiation transition (arrowheads, also see Movie S2). Scale bar: (A) 10 μm; (B) 10 μm / close-up 2 μm; (C) 5 μm; (D) 50 μm. See also Figure S2.
Figure 3
Figure 3. Ank3 regulation of postnatal SVZ niche formation
(A) IHC staining showing Ank3 upregulation in clusters during in vitro differentiation of pRGPs (hrs after plating). (B) Western-blot analyses of Ank3, β2-Spectrin, α-Adducin protein levels in pRGP culture under proliferating (3 days after plating) and differentiating conditions (8 days after plating). (C) Control and Ank3 shRNA lentiviral infection of pRGPs in culture, showing knock-down of Ank3 upregulation (arrows). Note the high infection efficiency. (D) Quantification of ependymal cluster formation in culture after lentiviral infection (see text and Figure S4B for details). * p < 0.05 Wilcoxon 2-sample test; error bar = sem; n = 5. (E) IHC staining of P5 ventricular wall wholemounts after P0 lentiviral-injection. Note that while Glast expression in control sample is largely concentrated to the center of Ank3 pinwheel-like structures (asterisks), after Ank3 knockdown most pRGPs still expressed high level of Glast, and showed disorganization (see also Figure S4C). Scale bar: (A, C, E) 20 μm. See also Figure S3 and S4.
Figure 4
Figure 4. Ank3 defects in conditional foxj1 mutant mice
(A) Schematic representation of the Foxj1-flox targeting strategy. N = NotI, E = EcoRI. Germ-line transmission of Flox allele was verified by PCR genotyping using primers p1 (external to targeting construct), p2, and p3. Allele was crossed to rosa26-flp, removing neomycin cassette for conditional Cre experiments; crossing to β-actin-Cre generated KO allele. (B) IHC staining of P3 ventricular wall wholemounts from control and Foxj1 cKO mice: note the lack of Ank3 expression in cKO pRGPs. (C) Western blot analyses of Ank3, β2-Spectrin, α-Adducin protein levels in differentiated pRGPs from control and cKO mice. (D) Lateral ventricular wall wholemount IHC staining from P6 control and cKO mice. (E) IHC staining of lateral ventricular wall section from P6 cKO; Foxj1-GFP mice showing that GFP+ cells at the ventricular surface have low-S100β, but high-Glast expression. Scale bar: (B) 5 μm; (D, E) 20 μm. See also Figure S5.
Figure 5
Figure 5. Foxj1 regulation of Ank3 during SVZ niche formation
(A) TEM of P4 ventricular wall lateral junctions between immature ependymal progenitors (iEp). Note the lack of interdigitation (*) / extension of apical adherens junctions (arrowheads) in cKO lateral borders. (B) Western blot analyses comparing N-cadherin expression levels during in vitro differentiation of pRGPs. (C) N-cadherin (N-cadh) IHC staining of P4 ventricular wall wholemounts in X-Y and X-Z planes. Cell borders visualized by Phalloidin (Ph) (traced by dashed lines for clarity). Ph and DAPI were used as landmarks to ensure cytoplasmic scanning in X-Z planes. (D) IHC analyses of N-cadherin expression in Foxj1 cKO pRGPs infected with lentivirus expressing 190 kD Ank3. Note the clearance of N-cadherin protein (*) from the cytoplasm of Foxj1 cKO pRGPs expressing Ank3 (arrowheads). (E) % of differentiated pRGP in culture with lateralized N-cadherin staining. In Foxj1 cKO rescue experiments, we assessed N-cadherin status in cells expressing infected Ank3. * p < 0.05 Wilcoxon 2-sample test; error bar = stdev.; n = 5. (F) Western blot and IHC analyses of Ank3 expression in cKO pRGPs infected with lentivirus expressing Foxj1-Myc. (G) Transcriptional activity of 5′ and 3′ enhancer elements assayed by luciferase constructs in pRGP cultures. * p < 0.001 Wilcoxon 2-sample test; error bar: sem; n = 6. (H) PCR primer amplification of 5′ Enh and 3′ Enh genomic DNA fragments after chromatin immunoprecipitation with Myc antibody from differentiated pRGPs. Scale bar: (A) 0.5 μm; (C, D, F) 5 μm. See also Figure S6.
Figure 6
Figure 6. Radial glial transition to SVZ stem cells in conditional Foxj1 mutant mice
(A) Stills from time-lapse live imaging movies of Foxj1-GFP+ cKO pRGPs during in vitro differentiation. Note the general lack of clustering between GFP-bright cells (also see Movie S3). (B) Quantification of cellular clustering from live imaging movies (see Figure S6A for details). * p < 0.05 Wilcoxon 2-sample test; error bar = sem; n = 5. (C) RC2 IHC staining of lateral ventricular wall sections, showing the presence (P2) and down-regulation (P6) of RC2 expression in both control and cKO mice. (D) IHC staining and quantification of Ki67+ cells on the ventricular wall surface from P6 control and cKO mice. n = 9. (E) In vitro differentiation of SVZ adherent neural stem cell cultures from P6 control and cKO mice, showing production of Tuj1+ neurons, GFAP+ astrocytes, and CNPase+ oligodendrocytes. Scale bar: (A, C, D) 50 μm; (E) 15 μm. See also Figure S7.
Figure 7
Figure 7. Inducible SVZ niche disruption results in neuroblast chain defects
IHC staining of ventricular wall wholemounts from P28 mice injected with tamoxifen at P14. (A) In control animal, DCX antibody staining showed the abundance of neuroblasts assembled into chains. R: rostral, C: caudal, D: dorsal; V: ventral. (B) foxj1-CreERt2; foxj1KO/Flox (iKO) mouse injected with tamoxifen showed disorganization in DCX+ neuroblast chains. Corresponding inverted image are marked with red showing areas of substantial Ank3 disruption on the ventricular surface. (C) Another example from iKO animal with tamoxifen injection. Corresponding inverted image shows large patches of ventricular Ank3 disruption and ventricular enlargement. (D) Close-up Z-stack images of ventricular wholemount from iKO animal showing neuroblast chain boundary (arrows) and areas of missing Ank3 (asterisks). Acetylated-tubulin (A-tub) shows surface cilia. (E) Nissl staining of olfactory bulb sections from control and iKO mice, showing defects in size (dashed areas, quantified) and cell density (insets) within the RMS. * p < 0.01 Wilcoxon 2-sample test; error bar = stdev.; n = 5. Scale bar: (A-C) 500 μm; (D) 20 μm; (E) 200 μm / close-up 50 μm. See also Figure S8.
Figure 8
Figure 8. Ank3 expression in SVZ niche is required for neuroblast production
(A) IHC staining of ventricular wholemounts from P28 control and iKO mice injected with tamoxifen at P14, showing abnormal GFAP+ patches in targeted areas. (B) SVZ NSC adherent culture from wild-type mice infected with lentivirus expressing Ank3 shRNA and GFP driven by ubiquitous EF1α promoter, showing abundant GFP+DCX+ neuroblasts 4 days after in vitro differentiation. (C) GFP staining of brain sections from mice transplanted with Ank3 shRNA-infected SVZ NSC culture, 7 and 28 days post transplantation. SCJ = striatal cortical junction; RMS = rostral migratory stream; GCL = granular cell layer; MCL = mitral cell layer. (D) IHC staining of wild-type pRGP niche cultures: 5 days after plating large numbers of DCX+ neuroblast clusters can be seen as well as Ank3+ niche progenitor clusters. (E) pRGP niche cultures infected with control versus Ank3 shRNA lentivirus, showing a dramatic reduction in the numbers of DCX+ neuroblast clusters (arrows), and quantified below (each cluster has greater than 5 DCX+ cells per DAPI staining, using same software acquisition as described in Figure S4B). * p < 0.01 Wilcoxon 2-sample test; error bar = stdev.; n = 5. Scale bar: (A) 50 μm; (B) 25 μm; (C) OB 500 μm, all others 50 μm; (D) 50 μm; (E) 100 μm / close-up 25μm.

References

    1. Abdi KM, Bennett V. Adducin promotes micrometer-scale organization of beta2-spectrin in lateral membranes of bronchial epithelial cells. Mol Biol Cell. 2008;19:536–545. - PMC - PubMed
    1. Alvarez-Buylla A, Lim DA. For the long run: maintaining germinal niches in the adult brain. Neuron. 2004;41:683–686. - PubMed
    1. Badis G, Berger MF, Philippakis AA, Talukder S, Gehrke AR, Jaeger SA, Chan ET, Metzler G, Vedenko A, Chen X, et al. Diversity and complexity in DNA recognition by transcription factors. Science. 2009;324:1720–1723. - PMC - PubMed
    1. Bejerano G, Siepel AC, Kent WJ, Haussler D. Computational screening of conserved genomic DNA in search of functional noncoding elements. Nat Methods. 2005;2:535–545. - PubMed
    1. Bennett V, Healy J. Organizing the fluid membrane bilayer: diseases linked to spectrin and ankyrin. Trends Mol Med. 2008;14:28–36. - PubMed

Publication types