. 2011 Jul 14;71(1):180-94.
doi: 10.1016/j.neuron.2011.05.032.

Multiple clusters of release sites formed by individual thalamic afferents onto cortical interneurons ensure reliable transmission

Affiliations

Multiple clusters of release sites formed by individual thalamic afferents onto cortical interneurons ensure reliable transmission

Martha W Bagnall et al. Neuron. .

Abstract

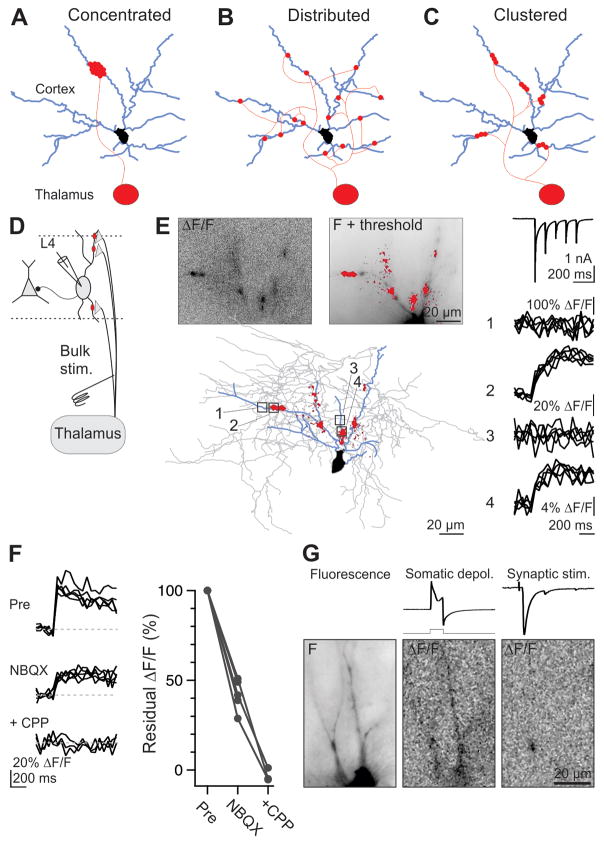
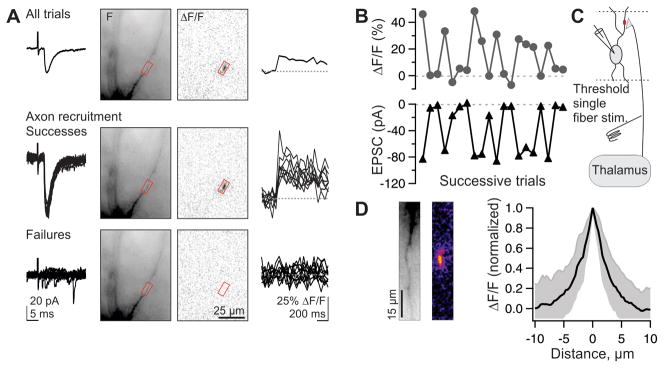
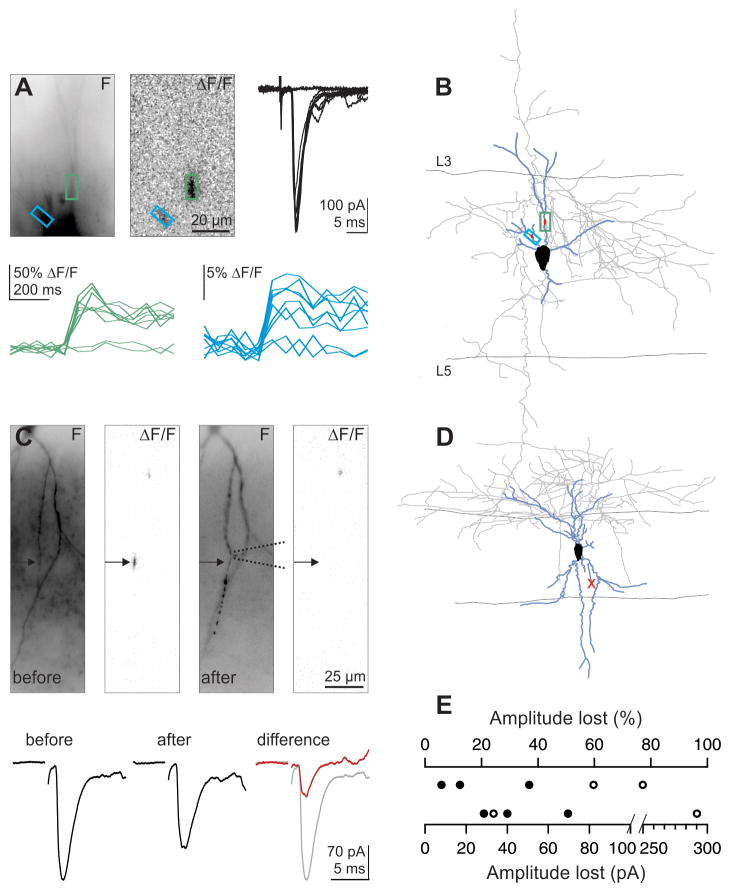
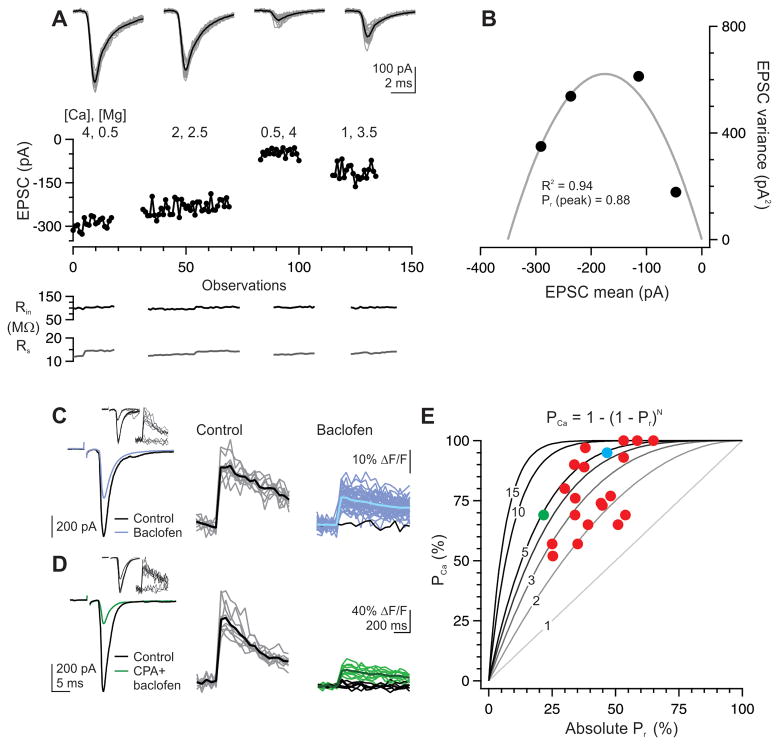
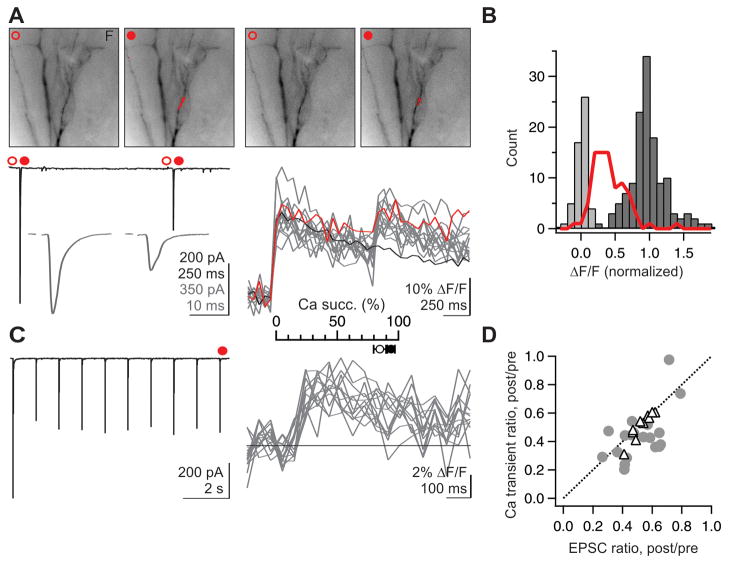
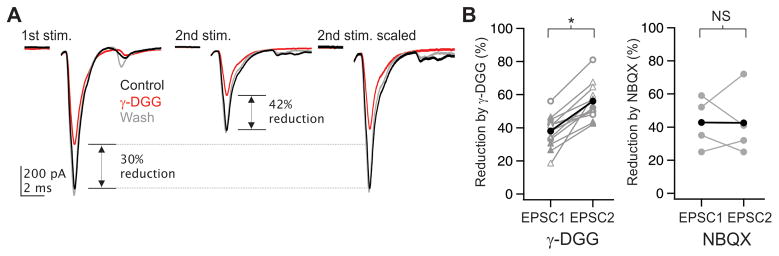
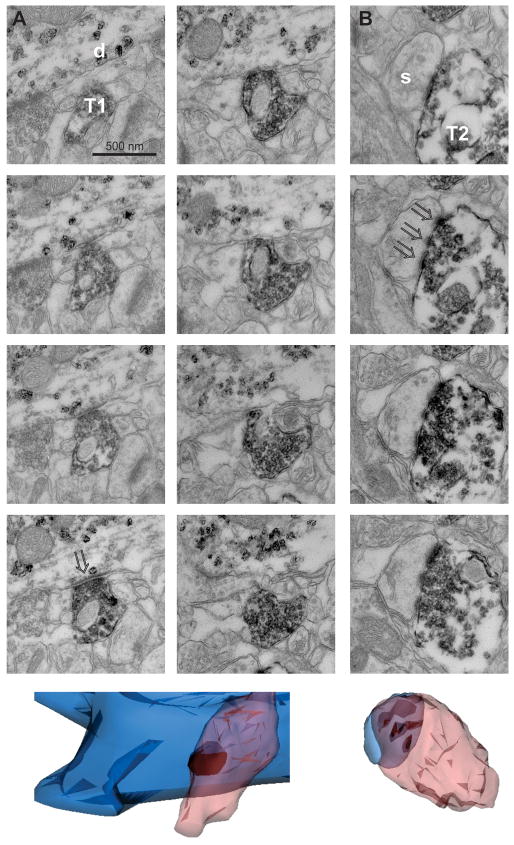
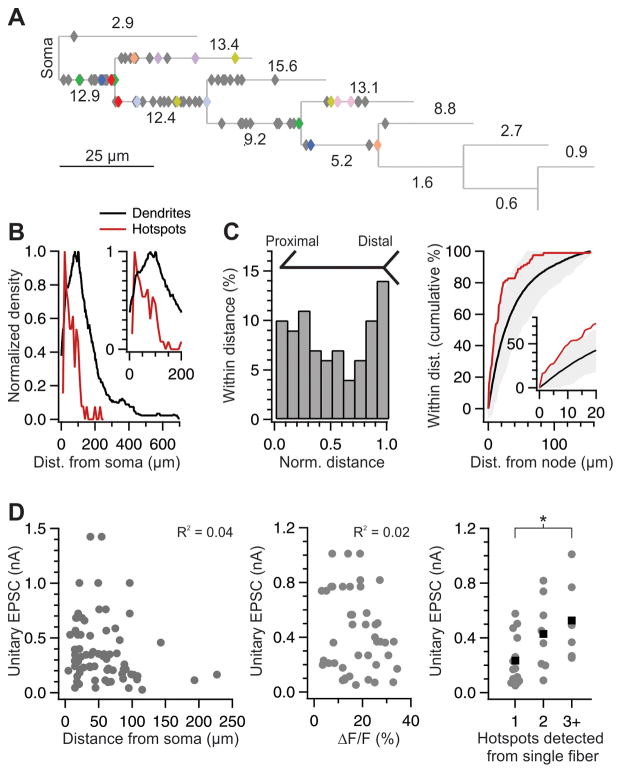
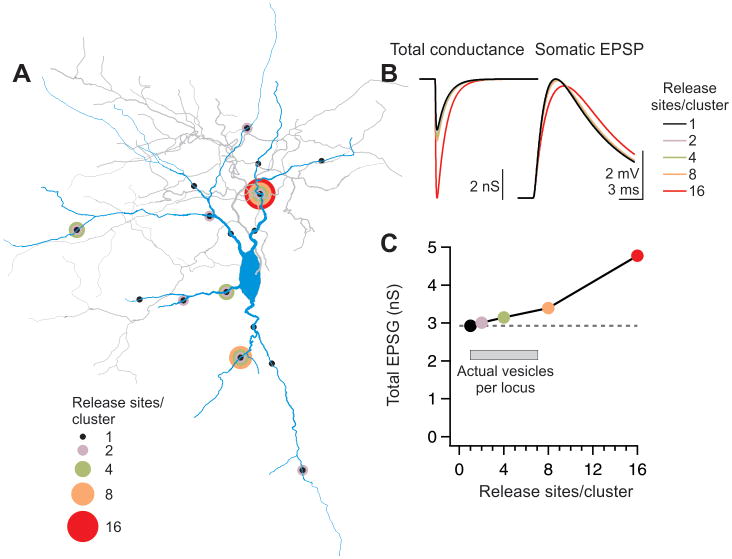
Thalamic afferents supply the cortex with sensory information by contacting both excitatory neurons and inhibitory interneurons. Interestingly, thalamic contacts with interneurons constitute such a powerful synapse that even one afferent can fire interneurons, thereby driving feedforward inhibition. However, the spatial representation of this potent synapse on interneuron dendrites is poorly understood. Using Ca imaging and electron microscopy we show that an individual thalamic afferent forms multiple contacts with the interneuronal proximal dendritic arbor, preferentially near branch points. More contacts are correlated with larger amplitude synaptic responses. Each contact, consisting of a single bouton, can release up to seven vesicles simultaneously, resulting in graded and reliable Ca transients. Computational modeling indicates that the release of multiple vesicles at each contact minimally reduces the efficiency of the thalamic afferent in exciting the interneuron. This strategy preserves the spatial representation of thalamocortical inputs across the dendritic arbor over a wide range of release conditions.


Figures

Figure 1
Figure 1. Stimulating thalamic axons generates Ca hotspots through glutamate receptor activation
(A–C) Configurations by which an individual thalamic axon may contact a cortical interneuron; each dot is a release site: (A), concentrated, (B), distributed, and (C) clustered. (D) Schematic of simultaneous physiological recording and Ca imaging from Layer IV interneurons during bulk stimulation of thalamic afferents. (E) (Top left) ΔF/F in response to bulk stimulation of thalamic afferents (average of 5 trials). (Top right) Thresholded ΔF/F (red) superimposed on fluorescence image of the recorded interneuron. (Bottom) Thresholded ΔF/F and reconstructed interneuron (blue: dendrites; gray axon). (Right traces, top) Synaptic current evoked by thalamic afferent stimulation (5 stimuli at 10 Hz; average of 5 sweeps) recorded in voltage clamp at −65 mV while imaging the interneuron on the left. (Traces 1–4) ΔF/F for four regions of interest (boxed areas on reconstruction). (F) (Left) Elimination of a Ca transient resulting from a single stimulus by sequential application of NBQX and CPP. (Right) Summary data for similar experiments (NBQX, n = 5; +CPP, n = 3). (See also Fig. S1). (G) (Left) Fluorescence image of recorded interneuron. (Middle) ΔF/F in response to somatic depolarization (from −60 to +20 mV for 5 ms, repeated 3 times at 5 Hz); top traces: current and square voltage step). (Right) ΔF/F in response to thalamic afferent stimulation (top trace: simultaneously recorded EPSC, amplitude 411 pA).
Figure 2
Figure 2. Activity of individual thalamic axons evokes spatially restricted dendritic Ca hotspots
(A) Threshold single fiber stimulation. (Top row) From left to right: Average uEPSC to 20 successive trials, recorded in voltage clamp. In this and subsequent figures, interneurons were clamped at −60 to −70 mV. Fluorescent image of recorded interneuron, ΔF/F, and time course of Ca transient recorded in the region of interest (red box). Middle and bottom, same as top but separated by individual successes (middle, 9 traces) and failures of axonal recruitment (bottom, 11 traces). (B) Co-fluctuation of successes and failures for Ca transients (top) and EPSCs (bottom) across successive trials of the experiment shown in (A). (C) Schematic of the experiment: Ca transients represent the activity of individual thalamic afferents. (D) (Left) Fluorescent image of dendrite. (Center) ΔF/F of Ca hotspot on the same dendrite, with warmer colors representing larger ΔF/F. (Right) Summary data for 64 hotspots: mean ± 1 standard deviation. Note the steep fall off of ΔF/F as a function of distance along the dendrite.
Figure 3
Figure 3. Individual thalamic axons can evoke multiple Ca hotspots
(A) Threshold single fiber stimulation. (Top) Fluorescence image of recorded interneuron (left), ΔF/F image (average of 7 trials; center) and synaptic currents (7 successes and 2 failures; right) (Bottom) Successes and failures of Ca transients recorded in the color coded region of interest illustrated above. Successes and failures of the two Ca transients co-fluctuate with the successes and failures of the uEPSC. (B) Reconstructed interneuron (blue, dendrites; gray, axon) from experiment in A with color coded regions of interest. (C) Single fiber stimulation (Top) Fluorescence image of recorded interneuron (left), ΔF/F image (average of 6 trials; second image), and fluorescence image (third image) and ΔF/F (right image, average of 7 trials) after aspiration of dendrite (the dotted lines symbolize the position of the aspiration pipette). (Bottom) Average synaptic response before (left, average of 6 trials) and after (right; average of 7 trials) aspiration of dendrite. (Right) The difference between the synaptic response before and after dendritic aspiration (red trace) is superimposed on the average trace before aspiration (gray trace). (D) Reconstructed interneuron (blue, dendrites; gray, axon) from experiment in A. The red × marks the aspirated dendrite. (E) Summary of 5 similar experiments. Closed circles represent experiments in which the dendrite was severed by aspiration; open symbols indicate those in which the dendrite was severely bent and the Ca hotspot disappeared.
Figure 4
Figure 4. Three release sites, on average, compose a single hotspot
(A) EPSCs recorded in an intreneuron during bulk stimulation of thalamic afferents under various concentrations of divalent ions and 1 mM kynurenate. In this example some bath solutions were washed in twice; sweeps are grouped together by condition (gray: individual sweeps, black: average). (B) Fitting the EPSC variance and mean to a binomial model yields a Pr of 0.88 for this cell in the 4 mM Ca, 0.5 mM Mg condition. (C) Application of the GABAB receptor agonist baclofen reduced the EPSC (left) by 43% but the Ca transient at the hotspot failed on only 1/40 trials (2.5%; right, black trace). Average of successful Ca transients is shown in black (control, center) or dark blue (baclofen, right). Inset, Ca transients at the hotspot responds selectively to recruitment of a thalamic axon as seen on 13 sequential trials of single fiber stimulation. In this example, a lower-threshold thalamic axon is also recruited but does not contribute to the Ca hotspot (inset, EPSC and Ca transients during threshold single-fiber stimulation). (D) As in (B), for a second example neuron in which both baclofen and the A1 receptor agonist CPA were used to reduce the EPSC by 75%; Ca transient at the hotspot succeeded on 10/16 trials (63%). Inset, EPSC and Ca transient during threshold single-fiber stimulation. (E) Data from 21 neurons (red dots) in which baclofen and/or the A1 agonist CPA (each 1–50 μM) were used to reduce Pr. Gray lines indicate the predicted relationship between Ca transient success rate (PCa) and Pr for the given number of release sites in a hotspot. The example neuron shown in C is colored blue; that in D is colored green. Excluding cells for which the Ca transients was successful on 100% of all trials (n = 3), the average N was 3.4 ± 0.4 release sites (SEM; n = 18).
Figure 5
Figure 5. Clustered release sites ensure locally reliable transmission
(A) Single fiber stimulation (Top) Each of two consecutive stimuli of thalamic afferents elicits a reliable hotspot, despite the ~50% depression of the second EPSC. Fluorescence images before and after the first (Left) and second (Right) stimulus, with overlaid thresholded ΔF/F. Images are averages of 3 frames from a single trial. (Bottom) Average EPSCs evoked by the two stimuli on two different time scales (left) and individual Ca transients in response to the two stimuli (14 superimposed traces). The example trial on top is shown in red. Black, the average Ca transient to a single stimulus (average of 14 traces). (B) Ca transients at a hotspot are graded. Distribution of ΔF/F values for individual trials in response to two consecutive stimuli for 7 experiments similar to A. ΔF/F values are normalized by the average ΔF/F in response to the first stimulus. Dark gray: ΔF/F in response to first stimulus; red: ΔF/F in response to second stimulus; Light gray: ΔF/F in response to “second” stimulus on interleaved 1-stimulus trials, as an indication of the noise. The Ca transient at each hotspot in response to the second stimulus is approximately half the Ca transient to the first stimulus. (C) Single fiber stimulation. EPSC and Ca transient resulting from 10-stimulus trains in a different cell. The Ca transient to the 10th EPSC was successful in 13/13 trials. The average response during the same time period to interleaved 9-stimulus trials has been subtracted from the ΔF/F (black line indicates 0). Inset, Summary of fraction of trials with successful Ca transients to the last stimulus for paired-pulse stimuli (filled circles, n = 7 cells) and 10-stimulus trains (open circles, n = 7). (D) Triangles: the average ratio of the second versus first Ca transient elicited by two consecutive stimuli is plotted against the ratio of the second versus first EPSC evoked by the same two stimuli (n = 11). Circles: the average ratio of the Ca transient recorded after versus before baclofen and/or CPA application is plotted against the ratio of the EPSC recorded after versus before the same conditions (n = 21). Ca transient failures are excluded from the averages (in both conditions), to illustrate the graded nature of the Ca signal at each hotspot (See also Supp. Fig. S2).
Figure 6
Figure 6. Diffusional domains of multiple vesicles of glutamate overlap at a common pool of postsynaptic receptors
(A) Bath application of 1 mM γ-DGG during a paired-pulse stimulus reduced the first EPSC by 30% and the 2nd EPSC by 42% in this example neuron. (Right) The 2nd EPSC scaled to match the peak of the 1st EPSC shows the relatively greater effect of γ-DGG, indicating a decrease in glutamate concentration. (B) (Left) Summary of data from 12 cells, recorded during single-fiber stimulation of thalamic afferents (open symbols) or bulk stimulation (closed symbols), showing a significantly larger effect of DGG on the 2nd as compared to the 1st EPSC (p < 0.0001). Data collected at ~21° C are represented as circles, those at ~32° C as triangles. (Right) In contrast, low concentrations (100 nM) of the high-affinity antagonist NBQX did not have a differential effect on the 1st and 2nd EPSCs.
Figure 7
Figure 7. Ultrastructure of the thalamic input to an interneuron
(A) (Top) Serial sections through the synaptic contact between a thalamic afferent (T1) and an interneuron dendrite (D), revealing a single bouton apposed to a single PSD (arrowhead). (Bottom) 3-dimensional reconstruction with the presynaptic thalamic bouton in peach, the postsynaptic dendrite in blue, and the PSD dark. (B) (Top) In contrast, afferent T2 synapses on an excitatory neuron spine (S) exhibiting a perforated PSD (arrowheads). Scale as in (A). (Bottom) 3-dimensional reconstruction reveals three separate PSDs on this spine.
Figure 8
Figure 8. Distribution of hotspots
(A) Average dendrogram of all reconstructed neurons (n= 53), with soma at left. Line length represents average straightened length of structures, e.g. tertiary branches that later bifurcate. Numbers indicate percentage of branches in each category (e.g., 2nd-order terminal branches represent 13.4% of all branches). More distal branches, representing < 1% of all branches, are not shown. Each diamond represents the location of a Ca hotspot (n = 85). Hotspots (diamonds) were placed on the dendrogram according to their structural location (e.g., halfway along a tertiary dendrite that later bifurcated), not according to their absolute distance from soma. Colored diamonds indicate pairs or triplets of hotspots generated by the activity of a single thalamic axon. The example neuron of Fig. 3A is in red. (B) Hotspots were detected more frequently in the proximal dendritic arbor. Normalized density of distribution of hotspots (red) and dendritic tree (hotspot-bearing dendrites only). Inset, magnified view of the first 200 μm. (C) Hotspots occur preferentially close to dendritic branch points. (Left) Bimodal distribution of hotspots in a plot of normalized inter-node distance. (Right) Cumulative percentage of hotspots that fell within the given distance from a dendritic branch point, with inset for distances < 20 μm. Black with gray shading indicates mean ± 2 × SD from repeated simulations of random hotspot distribution (see Methods). (D) Lack of correlation between uEPSC amplitude and hotspot proximity to soma (left; R2 = 0.04, p = 0.11; n = 70) or with hotspot intensity (middle, R2 = 0.02, p = 0.41; two large ΔF/F responses not shown). Large-amplitude uEPSCs are associated with higher numbers of Ca hotspots (right; means in black; * p = 0.03, Wilcoxon unpaired). (See also Fig. S3).
Figure 9
Figure 9. Clusters of 2–6 release sites cause only modest inefficiency of transmission
(A) Reconstructed interneuron anatomy imported into the NEURON modeling environment. Circles represent the location of modeled clusters of release sites. The number of release sites per cluster is color coded. The arrangement shown is an example; 8–16 different arrangements of cluster locations were modeled in the 1, 2, 4, and 8 release sites/locus configurations. (B) (Left) The total conductance (sum of the 16 release sites) necessary to generate a somatic EPSP of 5 mV increases with cluster size. (Right) The resulting average somatic EPSP in each condition. (C) The median total conductance necessary to generate an 5 mV EPSP at the soma is plotted against cluster size for three neurons modeled as in (B). The required conductance for concentrations of 16 release sites is more than 50% larger than the conductance for clusters of 2–4 release sites. (See also Fig. S4).

References

    1. Agmon A, Connors BW. Thalamocortical responses of mouse somatosensory (barrel) cortex in vitro. Neuroscience. 1991;41:365–379. - PubMed
    1. Ahmed B, Anderson JC, Martin KA, Nelson JC. Map of the synapses onto layer 4 basket cells of the primary visual cortex of the cat. J Comp Neurol. 1997;380:230–242. - PubMed
    1. Bathellier B, Margrie TW, Larkum ME. Properties of piriform cortex pyramidal cell dendrites: implications for olfactory circuit design. J Neurosci. 2009;29:12641–12652. - PMC - PubMed
    1. Beierlein M, Gibson JR, Connors BW. Two dynamically distinct inhibitory networks in layer 4 of the neocortex. J Neurophysiol. 2003;90:2987–3000. - PubMed
    1. Benshalom G, White EL. Quantification of thalamocortical synapses with spiny stellate neurons in layer IV of mouse somatosensory cortex. J Comp Neurol. 1986;253:303–314. - PubMed

Publication types

MeSH terms