. 2011 Oct;39(19):8503-12.
doi: 10.1093/nar/gkr566. Epub 2011 Jul 10.

Reconstitution of a functional IS608 single-strand transpososome: role of non-canonical base pairing

Affiliations

Reconstitution of a functional IS608 single-strand transpososome: role of non-canonical base pairing

Susu He et al. Nucleic Acids Res. 2011 Oct.

Abstract

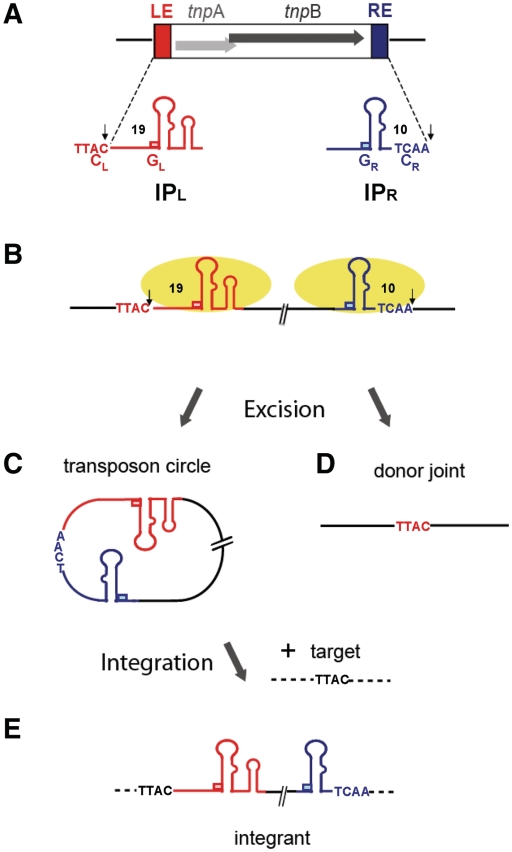
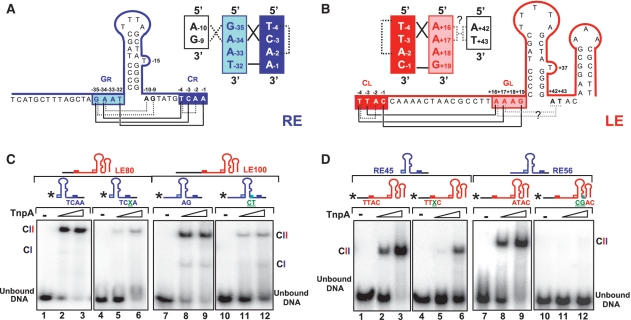
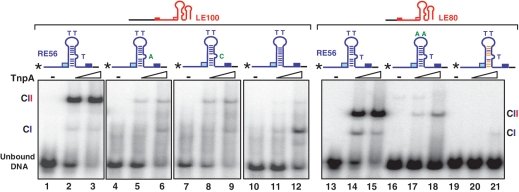
Single-stranded (ss) transposition, a recently identified mechanism adopted by members of the widespread IS200/IS605 family of insertion sequences (IS), is catalysed by the transposase, TnpA. The transposase of IS608, recognizes subterminal imperfect palindromes (IP) at both IS ends and cleaves at sites located at some distance. The cleavage sites, C, are not recognized directly by the protein but by short sequences 5' to the foot of each IP, guide (G) sequences, using a network of canonical ('Watson-Crick') base interactions. In addition a set of non-canonical base interactions similar to those found in RNA structures are also involved. We have reconstituted a biologically relevant complex, the transpososome, including both left and right ends and TnpA, which catalyses excision of a ss DNA circle intermediate. We provide a detailed picture of the way in which the IS608 transpososome is assembled and demonstrate that both C and G sequences are essential for forming a robust transpososome detectable by EMSA. We also address several questions central to the organization and function of the ss transpososome and demonstrate the essential role of non-canonical base interactions in the IS608 ends for its stability by using point mutations which destroy individual non-canonical base interactions.


Figures

Figure 1.
Figure 1.
IS608 and its transposition cycle. The left (LE) and right (RE) IS ends are shown in red and blue, respectively. (A) IS608 organization. Grey horizontal arrows: tnpA and tnpB; red and blue boxes, left (LE) and right (RE) ends (colour code retained throughout). The subterminal secondary structures IPL and IPR, the left (TTAC) and right (TCAA) cleavage (CL and CR) and guide (GL and GR) sequences and the distances in nucleotides between CL or CR and the foot of IPL or IPR are indicated. The cleavage sites are indicated by small vertical arrows. Flanking DNA is shown as black horizontal lines. (B) Binding and cleavage by TnpA. TnpA molecules are shown as yellow ellipses. The active top strand is shown in bold. Note that a 5′ phosphotyrosine bond is formed with LE and with the RE 5′ flank (arrows). (C) The IS608 ss circle intermediate. Excision of the IS608 ss circle intermediate with abutted left and right ends retaining the right cleavage site, TCAA. (D) The donor replicon after IS608 excision. Excision of the IS608 ‘top strand’ leads to rejoining of the left and right ends to form a transposon joint retaining the TTAC target sequence. (E) Integration. The circular IS recognizes the TTAC target sequence and inserts 3′ of this sequence.
Figure 2.
Figure 2.
Synaptic complexes. (A) EMSA analysis of complexes formed between TnpA and LE (left panel) and TnpA and RE (right panel). The experiments were performed in the absence of Mg2+. The nature of the two complexes CI and CII are described in the text. LE80 and RE70 indicate the length of the oligonucleotides used (Supplementary Table S1). Asterisk indicates the 5′ label and the light coloured boxes represent the guide sequences GR (pale blue) and GL (pink). The full boxes represent the cleavage sequences CL (red) and CR (blue). ‘–’ indicates absence of TnpA-His6. Increasing TnpA-His6 concentrations (0.5 and 2.5 µM) are indicated by the triangle. Complexes were separated in 8% polyacrylamide native gels. (B) EMSA analysis of DNA content of CI and CII. Lanes 1–4: 5′ end-labelled RE70 with excess unlabelled RE70 (lanes 1 and 2); with excess unlabelled RE49 (lanes 3 and 4). Lanes 5–8: 5′ end-labelled RE49 with excess unlabelled RE70 (lanes 5 and 6); with excess unlabelled RE49 (lanes 7 and 8). Triangle presents different TnpA-His6 concentration (0.1 and 2.5 µM). The bands indicated by roman numerals were cut from the gel and used for the analysis of catalytic activity presented in Figure 3C.
Figure 3.
Figure 3.
Identification of the IS608 transpososome. (A) Identification of complexes including both RE and LE. The 5′-end-labelled RE49 (lanes 1–5); alone (lane 1); with TnpA and excess unlabelled RE49 (lanes 2 and 3); with TnpA and excess unlabelled LE80 (lanes 4 and 5); 5′-end-labelled LE80 (lanes 6–10) alone (lane 10); with TnpA and excess unlabelled LE80 (lanes 8 and 9); with TnpA and excess unlabelled RE49 (lanes 6 and 7). Asterisk indicates the 5′ label. Triangle presents different TnpA-His6 concentration (0.5 and 2.5 µM). The band indicated by vii was cut from the gel and used for the analysis of catalytic activity presented in Figure 3C. (B) Identification of crosslinked TnpA. CII composed of two REs (RE49F) or one RE and one LE (LE63) were excised from an EMSA gel and treated with the crosslinking agent BMH. They were loaded onto an SDS–PAGE gel and identified by western-blot using a 6His-HRP antibody. Lane 1: TnpA-His6 alone; lane 2: CII carrying two RE49F treated with BMH (the subscript F indicates that the oligonucleotides used were labelled with a 3′ fluorescein to identify the synaptic complexes to be isolated from the initial EMSA gel; see oligonucleotide list, Supplementary Table S1); lane 3: CII carrying one RE49F and one LE63 treated with BMH. (C) Activities of CI and CII. Bands labelled with roman numerals in Figures 2B and 3A were excised from the gels and soaked in a cleavage buffer containing Mg2+ for 3 h. DNA was eluted and analysed on a 9% denatured sequencing gel. Lane 2 and lane 6: CI composed of TnpA-His6 carrying only one DNA end RE70 or RE49; lane 1 and lane 5: CII composed of TnpA-His6 carrying two same DNA ends RE70 or RE49; lane 4: CII composed of TnpA-His6 carrying RE49 and RE70; lane 3: CII composed of TnpA-His6 carrying RE49 and LE80.
Figure 4.
Figure 4.
DNA sequences necessary for transpososome stability. (A) Sequences required in RE. EMSA of excess unlabelled LE100 mixed with 5′-end-labelled RE derivatives performed with 0, 0.5 and 2.5 µM TnpA-His6. Two complexes with different mobility are indicated as CI and CII. Lanes 1–3, wt RE56; lanes 4–6, precleaved RE45; lanes 7–9, RE45 deleted for DNA 5′ to GR; lanes 10–12, RE45 deleted for DNA 5′ to GR and mutated in CR (TCAA to AGAG); lanes 13–15, RE45 deleted for CR; lanes 16–18, RE48 deleted for GR. (B) Sequences required in LE. EMSA of excess unlabelled RE56 mixed with 5′-end-labelled LE derivatives performed with 0, 0.5 and 2.5 µM TnpA-His6. Lanes 1–3, wild-type LE80; lanes 4–6, LE63, deleted for the 3′ potential secondary structure; lanes 7–9, LE59 deleted for the ATAC tetranucleotide 3′ to the foot of IPL; lane 10–12, LE64, lacking the 5′ left flanking DNA but retaining CL; lanes 13–15, LE60, precleaved LE lacking the 5′ left flanking DNA and CL; lanes 16–20, LE45 retaining only GL 5′ to IPL and the region 3′ to IPL without (lanes 17 and 18) or with (lanes 19 and 20) Mg2+; lanes 21–25, LE41 deleted for GL 5′ to IPL but retaining the region 3′ to IPL without (lanes 22 and 23) or with (lanes 24 and 25) Mg2+; lanes 26–28, LE80 mutated in GL (AAAG to GGAA) ‘*’ indicates 5′ label.
Figure 5.
Figure 5.
Non-canonical base interactions. (A) Schematic of the canonical and non-canonical base interactions in RE as identified from the crystal structure. Cleavage sequence CR is shown in dark blue, guide sequence GR in pale blue. The left hand section shows the nucleotide sequence of RE and the base paring within IPR. The extra-helical T is also indicated. The filled lines beneath indicate base canonical interactions between CR and GR. The dotted lines indicate additional non-canonical base interactions. These are schematized in the cartoon on the right. The nucleotide coordinates are those from (20). (B) Schematic of the canonical and non-canonical base interactions in LE as identified from the crystal structure. CL is shown in red, GL in pink. The right hand section shows the nucleotide sequence of LE and the base paring within IPL. Base interactions are marked as for RE. It should be noted that the base triplets indicated between the AT of the ATAC tetranucleotide have not been demonstrated by crystallography but are implied from the results obtained here. (C) Effect of mutations in non-canonical base interactions in RE. EMSA of 5′ labelled WT RE45 (lanes 1–3) or 2-aminopurine modified RE45 (lanes 4–6) and unlabelled LE80 with 0, 0.5 and 2.5 µM TnpA-His6. EMSA of 5′ labelled WT RE56 (lanes 7–9) or A−10G−9 mutated RE (lanes 10–12) and unlabelled LE100 with 0, 0.5 and 2.5 µM TnpA-His6. Two complexes with different mobility are indicated as CI and CII. X is 2-amino purine (2-AP). (D) Effect of mutations in non-canonical base interactions in LE. EMSA of 5′-labelled WT LE80 (lanes 1–3) or 2-aminopurine modified LE80 (lanes 4–6) and unlabelled RE45 with 0, 0.5 and 2.5 µM TnpA-His6. EMSA of 5′ labelled WT LE80 (lanes 7–9) or A+42T+43 mutated LE (lanes 10–12) and unlabelled RE56 with 0, 0.5 and 2.5 µM TnpA-His6. X is 2-amino purine (2-AP) ‘*’ indicates 5′ label.
Figure 6.
Figure 6.
IP shape and synaptic complex stability. Role of extra-helical T in RE (lanes 1–12). EMSA of excess unlabeled LE100 with 5′ labelled WT RE56 or RE mutant in which T−15 was mutated to A or C or deleted performed with 0, 0.5 and 2.5 µM TnpA-His6. Two complexes with different mobility are indicated as CI and CII. Role of tip Ts and IP shape of RE (lanes 13–21). EMSA of excess unlabeled LE80 with 5′ labelled WT RE56 or RE mutants in which T−21T−22 was mutated to AA or the bases of IPR stem which do not interact directly with the protein was reversed performed with 0, 0.5 and 2.5 µM TnpA-His6. Two complexes with different mobility are indicated as CI and CII. The blue lines inside the IP indicate the original base pairing while the orange lines show pairing of the reversed bases (Supplementary Table S1) ‘*’ indicates 5′ label.

Similar articles

Cited by

References

    1. Siguier P, Filee J, Chandler M. Insertion sequences in prokaryotic genomes. Curr. Opin. Microbiol. 2006;9:526–531. - PubMed
    1. Aziz RK, Breitbart M, Edwards RA. Transposases are the most abundant, most ubiquitous genes in nature. Nucleic Acids Res. 2010;38:4207–4217. - PMC - PubMed
    1. Guynet C, Hickman AB, Barabas O, Dyda F, Chandler M, Ton-Hoang B. In vitro reconstitution of a single-stranded transposition mechanism of IS608. Mol. Cell. 2008;29:302–312. - PubMed
    1. Ronning DR, Guynet C, Ton-Hoang B, Perez ZN, Ghirlando R, Chandler M, Dyda F. Active site sharing and subterminal hairpin recognition in a new class of DNA transposases. Mol. Cell. 2005;20:143–154. - PubMed
    1. Ton-Hoang B, Guynet C, Ronning DR, Cointin-Marty B, Dyda F, Chandler M. Transposition of ISHp608, member of an unusual family of bacterial insertion sequences. EMBO J. 2005;24:3325–3338. - PMC - PubMed

Publication types