. 2011 Oct;39(19):8472-87.
doi: 10.1093/nar/gkr567. Epub 2011 Jul 10.

Chk2-dependent HuR phosphorylation regulates occludin mRNA translation and epithelial barrier function

Affiliations

Chk2-dependent HuR phosphorylation regulates occludin mRNA translation and epithelial barrier function

Ting-Xi Yu et al. Nucleic Acids Res. 2011 Oct.

Abstract

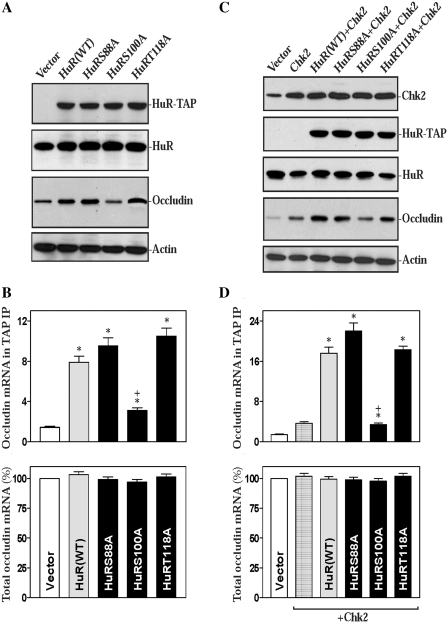
Occludin is a transmembrane tight junction (TJ) protein that plays an important role in TJ assembly and regulation of the epithelial barrier function, but the mechanisms underlying its post-transcriptional regulation are unknown. The RNA-binding protein HuR modulates the stability and translation of many target mRNAs. Here, we investigated the role of HuR in the regulation of occludin expression and therefore in the intestinal epithelial barrier function. HuR bound the 3'-untranslated region of the occludin mRNA and enhanced occludin translation. HuR association with the occludin mRNA depended on Chk2-dependent HuR phosphorylation. Reduced HuR phosphorylation by Chk2 silencing or by reduction of Chk2 through polyamine depletion decreased HuR-binding to the occludin mRNA and repressed occludin translation, whereas Chk2 overexpression enhanced (HuR/occludin mRNA) association and stimulated occludin expression. In mice exposed to septic stress induced by cecal ligation and puncture, Chk2 levels in the intestinal mucosa decreased, associated with an inhibition of occludin expression and gut barrier dysfunction. These results indicate that HuR regulates occludin mRNA translation through Chk2-dependent HuR phosphorylation and that this influence is crucial for maintenance of the epithelial barrier integrity in the intestinal tract.


Figures

Figure 1.
Figure 1.
HuR binds the occludin mRNA. (A) Schematic representative of the occludin mRNA and the predicted hits of the HuR signature motif in its 3′-UTR. (B) Association of endogenous HuR with endogenous occludin mRNA. After IP of RNA-protein complexes from cell lysates using either anti-HuR antibody (Ab) or control IgG1, RNA was isolated and used in RT reactions. RT–PCR products of occludin and c-Myc were visualized in ethidium bromide-stained agarose gels; low-level amplification of GAPDH (housekeeping mRNA, which is not HuR targets) served as negative controls. (C) Fold differences in occludin transcript abundance in HuR IP compared with IgG IP in cells described in panel (B), as measured by RT–qPCR analysis. Values were means ± SEM from triplicate samples. (D) Representative HuR and TIAR immunoblots using the pull-down materials by biotinylated transcripts of the occludin CR or 3′-UTR. Cytoplasmic lysates were incubated with 6 µg of biotinylated occludin CR or 3′-UTR, and the resulting RNP complexes were pulled down by using streptavidin-coated beads. The presence of HuR or TIAR in the pull-down material was assayed by western blotting. β-actin in the pull-down material was also examined and served as a negative control. (E) HuR-binding to different fractions of 3′-UTR of the occludin mRNA. Top panel, schematic representation of the occludin 3′-UTR biothinylated transcripts. After incubation of cytoplasmic lysates with the full-length (FL) or various fractions (F) of the occludin 3′-UTR, the resulting RNP complexes were pulled down, and the abundance of HuR and β-actin proteins in the pull-down material was examined. (F) Mapping the HuR-binding sites in F3 of the occludin 3′-UTR. Top panel, schematic representation of the biotinylated transcripts of F3 used in this study.
Figure 2.
Figure 2.
Changes in occludin translation after HuR silencing. (A) Representative immunoblots of HuR and occludin proteins. After cells were transfected with either siRNA targeting the HuR mRNA coding region (siHuR) or control siRNA (C-siRNA) for 48 or 72 h, whole-cell lysates were harvested for western blot analysis. (B) Levels of occludin mRNA in cells treated as described in panel (A). Total RNA was harvested, and the levels of occludin mRNA were measured by RT–qPCR analysis. Data were normalized to GAPDH mRNA levels, and values are means ± SEM of data from triplicate experiments. (C) Newly translated occludin protein. Occludin translation was measured by incubating cells with L-[35S]methionine and L-[35S]cysteine for 30 min, followed by immunoprecipitation using an anti-occludin antibody, resolving the immunoprecipitated samples by SDS–PAGE, transferring the samples, and visualization of signals by using a PhosphorImager. (D) Polysomal profiles from cells 48 h after transfection with C-siRNA (a) or siHuR (b). Nuclei were pelleted, and the resulting supernatants were fractionated through a 10–50% linear sucrose gradient. (E) Distributions of occludin (left) and GAPDH (right) mRNAs in each gradient fraction prepared from cells described in panel (D). Total RNA was isolated from the different fractions, and the levels of occludin and GAPDH mRNAs were measured by RT–qPCR analysis and plotted as a percentage of the total occludin or GAPDH mRNA levels in that sample. NB, not bound to polysomes; NT, not translated; LMW, low-molecular-weight polysomes; HMW, high-molecular-weight polysomes. Three independent experiments were performed and showed similar results. (F) Changes in occludin translation efficiency as measured by occludin 3′-UTR-luciferase reporter assays. Left, schematic of plasmids: (a), control (pGL3-Luc); (b), chimeric firefly luciferase-occludin 3′-UTR (Luc-Occl-3′-UTR). Right, levels of occludin translation. The Luc-Occl-3′-UTR or pGL3-Luc (negative control) was cotransfected with a Renilla luciferase reporter. Luciferase values were normalized to the mRNA levels to obtain translation efficiencies and expressed as means ± SEM of data from three separate experiments. *P < 0.05 compared with cells transfected with C-siRNA. (G) Changes in paracellular permeability as measured by using the membrane-impermeable trace molecule 14C-mannitol. Values are means ± SEM of data from six samples. *P < 0.05 compared with cells transfected with C-siRNA.
Figure 3.
Figure 3.
Changes in occludin translation after ectopic HuR overexpression. (A) Representative immunoblots of HuR-TAP fusion protein (HuR-TAP), endogenous HuR and occludin proteins. Cells were transfected with the vector expressing wild-type HuR-TAP or control emptying vector; protein levels were measured by western immunoblotting analysis 48 h after the transfection using specific antibody against TAP, HuR or occludin. (B) Changes in occludin translation efficiency as measured by using pGL3-Luc-Occl-3′-UTR reporter assays in cells described in panel (A). Twenty-four hours after cells were transfected with the Luc-Occl-3′-UTR or pGL3-Luc, the levels of luciferase activity were examined and normalized to the mRNA levels to obtain translation efficiencies. Values were expressed as means ± SEM of data from three separate experiments. *P < 0.05 compared with controls and cells transfected with emptying vector. (C) Levels of occludin mRNA as measured by RT–qPCR analysis in cells described in panel (A). The data were normalized to GAPDH mRNA levels, and shown as the means ± SEM of data from triplicate experiments. (D) Changes in paracellular permeability as measured by the membrane-impermeable trace molecule 14C-mannitol flux assays. Values are means ± SEM of data from six samples. *P < 0.05 compared with controls and cells transfected with the emptying vector alone.
Figure 4.
Figure 4.
Chk2-dependent HuR phosphorylation regulates HuR-binding to occludin mRNA and alters its translation. (A) Representative immunoblots of Chk2, total HuR (T-HuR) and phosphorylated HuR (p-HuR) after Chk2 silencing. Cells were transfected with either siRNA targeting the Chk2 mRNA coding region (siChk2) or control siRNA (C-siRNA) for 48 h, and whole-cell lysates were harvested for western blot analysis to examine the levels of Chk2 and HuR, and loading control β-actin. To assess the levels of p-HuR, cell lysates were subjected to IP using an anti-HuR antibody, and the precipitates were analyzed by western blotting with the antibody against phosphorylated proteins (pProteins) or anti-HuR antibody. (B) Changes in HuR-binding to occludin mRNA as detected by biotin pull down assays: (a) binding to 3′-UTR; and (b) binding to coding region (CR). (C) Association of endogenous HuR with endogenous occludin mRNA in cells described in (A). Whole-cell lysates were used for IP in the presence of anti-HuR antibody or nonspecific IgG; and the levels of occludin and GAPDH mRNAs in the IP material were examined by RT–qPCR analysis. Values are the means ± SEM of data from three samples. *P < 0.05 compared with cells transfected with the C-siRNA. (D) Changes in occludin translation efficiency (a) and occludin mRNA levels (b) as measured by using Luc-Occl-3′-UTR reporter assays and RT–qPCR analysis in cells described in (A). Data were expressed as means ± SEM of data from three separate experiments. *P < 0.05 compared with cells transfected with Con-siRNA. (E) Levels of occludin protein in Chk2-silenced cells. Data are representative from three independent experiments showing similar results. (F) Changes in paracellular permeability. Values are means ± SEM of data from six samples. *P < 0.05 compared with controls and cells transfected with C-siRNA.
Figure 5.
Figure 5.
Impact of deleting the HuR-interacting RNA from the occludin 3′-UTR on HuR-mediated occludin translation. (A and B) Changes in the levels of occludin 3′-UTR luciferase reporter activity in Chk2-silenced cells. Top panels: schematic of firefly luciferase (FL) reporter constructs containing different fragments of the occludin 3′-UTR. Twenty-four h after the cells were transfected with either siRNA targeting the Chk2 mRNA coding region (siChk2) or control siRNA (C-siRNA), the cells were further transfected with each of various occludin 3′-UTR luciferase reporter constructs and a Renilla luciferase control reporter. The levels of firefly and Renilla luciferase activities were assayed 24 h later. The results were normalized to the Renilla luciferase activity and are shown as the means ± SEM of data from three separate experiments. *P < 0.05 compared with cells transfected with C-siRNA. (C) Activity of luciferase reporters containing the occludin 3′-UTR with the S4 mutation after silencing HuR or Chk2. Cells were initially transfected with either siHuR, siChk2 or C-siRNA and 24 h later they were further transfected with pL-FL or pL-FL-MS4 together with the Renilla luciferase reporter. *P < 0.05 compared with cells transfected with C-siRNA. (D) Changes in HuR association with the occludin 3′-UTR after deleting the S4 sequence. Twenty-four hours after cells were transfected with pL-FL or pL-FL-MS4, whole-cell lysates were used for IP in the presence of anti-HuR antibody (left) or non-specific IgG1 (right). RNA in the IP material was used in RT–PCR reactions to detect the presence of occludin 3′-UTR (S3–S5), and the resulting PCR product (402 bp) were visualized in agarose gels. Three separate experiments were performed that showed similar results.
Figure 6.
Figure 6.
Ectopic overexpression of HuR carrying point mutations modulates occludin expression by altering (HuR/occludin mRNA) association. (A) Representative immunoblots of HuR-TAP fusion proteins (HuR-TAP), endogenous HuR, and occludin proteins. Cells were transfected with the vector expressing wild-type (WT) HuR-TAP or mutated HuR-TAP fusion proteins, and the protein levels were measured by western immunoblotting analysis 48 h after the transfection using specific antibody against TAP, HuR or occludin. (B) Changes in levels of the occludin mRNA in TAP IP materials (top) and total occludin mRNA (bottom) in cells described in panel (A). Total occludin mRNA levels were measured by RT–qPCR analysis, while binding of chimeric HuR-TAP proteins to occludin mRNA was examined by performing TAP IP followed by RT–qPCR analysis. Values are means ± SEM of data from three separate experiments. *, +P < 0.05 compared with controls (vector) and cells transfected with the HuR(WT)-TAP, respectively. (C) Changes in levels of occludin protein after overexpression of Chk2 and chimeric HuR-TAP proteins. Cells were cotransfected with the Chk2 expression vector (Chk2) and vectors expressing HuR (WT)-TAP or mutated HuR-TAP fusion proteins. The levels of Chk2, HuR-TAP, endogenous HuR and occludin proteins were measured 48 h after the transfection. (D) Changes in levels of the occludin mRNA in TAP IP materials (top) and total occludin mRNA (bottom) in cells described in panel (C) as measured by RT–qPCR analysis. *P < 0.05 compared with cells transfected with the emptying vector; +P < 0.05 compared with cells cotransfected with Chk2 and HuR(WT)-TAP.
Figure 7.
Figure 7.
Polyamine depletion represses occludin translation by decreasing Chk2-dependent HuR phosphorylation. (A) Representative immunoblots of Chk2, total HuR (T-HuR), and phosphorylated HuR (p-HuR) in polyamine-deficient cells. After cells were grown in control media and in media containing DFMO (5 mM) or DFMO plus putrescine (Put; 10 µM) for 4 days, whole cell lysates were harvested. The levels of Chk2, T-HuR and p-HuR were measured by western blot analysis, while the levels of p-HuR were examined by immunoprecipitation (IP) assays. (B) Changes in HuR-binding to occludin mRNA as detected by biotin pull down assays in cells described in panel (A): (a) binding to 3′-UTR; and (b) binding to coding region (CR). (C) Association of endogenous HuR with endogenous occludin mRNA as measured by RNP–IP/RT–qPCR assays. Values are means ± SEM of data from six samples. *P < 0.05 compared with controls and cells treated with DFMO plus Put. (D) Changes in occludin translation efficiency as measured by Luc-Occl-3′-UTR reporter assays in cells described in (A). Data were expressed as means ± SEM of data from three samples. *P < 0.05 compared with controls and cells exposed to DFMO plus Put. (E) Representative immunoblots of occludin protein. (F) Changes in paracellular permeability in cells described in panel (A). Values are means ± SEM of data from six samples. *P < 0.05 compared with controls and cells exposed to DFMO plus Put.
Figure 8.
Figure 8.
Reduction in Chk2 associates with inhibition of the occludin expression and gut barrier dysfunction in mice exposed to CLP. (A) Representative immunoblots of Chk2, occludin and HuR proteins in the small intestinal mucosa after CLP. The mucosal tissues were harvested at different times as indicated after CLP surgery; and changes in the levels of Chk2, occludin and HuR proteins were measured by western immunoblotting analysis. The results in each panel were from separate experiments. (B) Immunohistochemical staining of Chk2 in the small intestinal mucosa in control (a) and mice exposed to CLP for 24 h (b). c, crypt; v, villous; arrow, Chk2 immunostaining. (C) Changes in gut permeability as measured by FITC-dextran tracer flux assays in animals described in panel (A). FITC-dextran was given orally, and blood samples were collected 4 h thereafter for measurement. Values are means ± SEM of data from five samples. *,+P < 0.05 compared with controls (0 h) and animals exposed to CLP for 24 h, respectively. (D) Association of HuR with occludin mRNA in the small intestinal mucosa as measured by RNP–IP/RT–qPCR analysis. Values are means ± SEM of data from five samples. *,+P < 0.05 compared with controls (0 h) and animals exposed to CLP for 24 h, respectively. (E) The levels of total occludin mRNA in the intestinal mucosa as measured by RT–qPCR analysis in mice exposed to CLP. Values are means ± SEM of data from five samples.
Figure 9.
Figure 9.
Polyamine depletion reduces (HuR/occludin mRNA) association and delays the recovery of occludin expression and gut barrier function in CLP-mice. (A) Changes in the levels of occludin mRNA in HuR IP materials (top) and total occludin mRNA (bottom). After CLP surgery, mice were injected i.p. with saline or DFMO at the dose of 5 mg/10-g body wt, followed by 2% DFMO in their drinking water throughout the experiment. Binding of HuR to occludin mRNA was examined by RNP-IP/RT–qPCR analysis, while total occludin mRNA levels were measured by RT–qPCR analysis. Values are means ± SEM of data from five samples. *P < 0.05 compared with CLP-mice treated with saline. (B) Representative immunoblots of occludin protein in the small intestinal mucosa from mice described in panel (A). (C) Changes in gut permeability as measured by FITC-dextran tracer flux assays. Values are means ± SEM of data from five samples. *P < 0.05 compared with CLP-mice treated with saline.

Similar articles

Cited by

References

    1. Turner JR. Intestinal mucosal barrier function in health and disease. Nat. Rev. Immunol. 2009;9:799–809. - PubMed
    1. Schulzke JD, Fromm M. Tight junctions: molecular structure meets function. Ann. NY Acad. Sci. 2009;1165:1–6. - PubMed
    1. Förster C. Tight junctions and the modulation of barrier function in disease. Histochem. Cell Biol. 2008;130:55–70. - PMC - PubMed
    1. Funke L, Dakoji S, Bredt DS. Membrane-associated guanylate kinases regulate adhesion and plasticity at cell junctions. Annu. Rev. Biochem. 2005;74:219–245. - PubMed
    1. Nejsum LN, Nelson WJ. A molecular mechanism directly linking E-cadherin adhesion to initiation of epithelial cell surface polarity. J. Cell Biol. 2007;178:323–335. - PMC - PubMed

Publication types

MeSH terms