. 2011 Sep 1;589(17):4271-300.
doi: 10.1113/jphysiol.2011.210435. Epub 2011 Jul 11.

Temporal characteristics of vesicular fusion in astrocytes: examination of synaptobrevin 2-laden vesicles at single vesicle resolution

Affiliations

Temporal characteristics of vesicular fusion in astrocytes: examination of synaptobrevin 2-laden vesicles at single vesicle resolution

Erik B Malarkey et al. J Physiol. .

Abstract

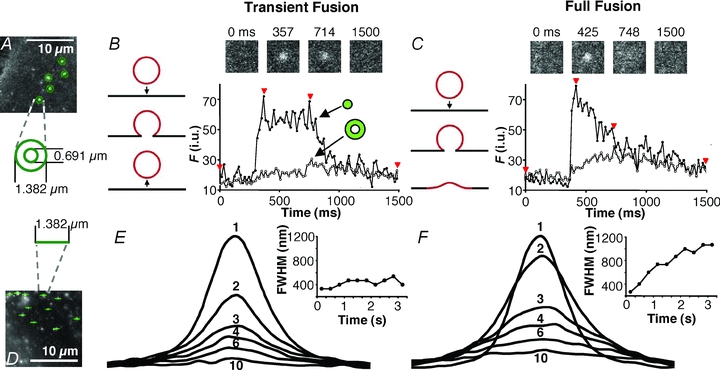
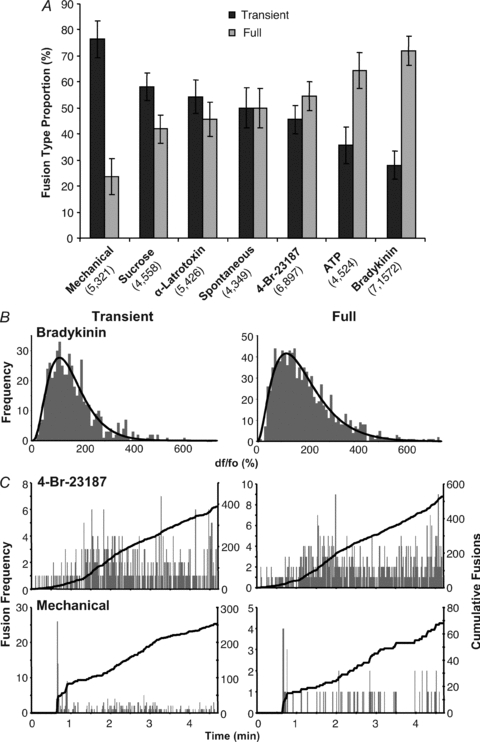
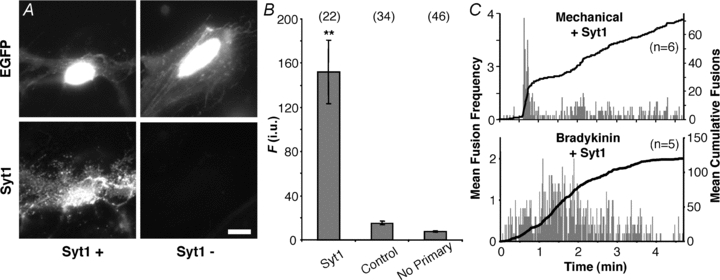
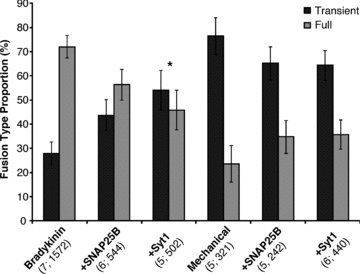
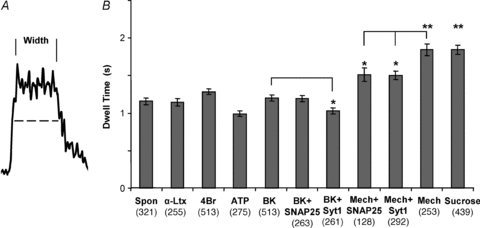
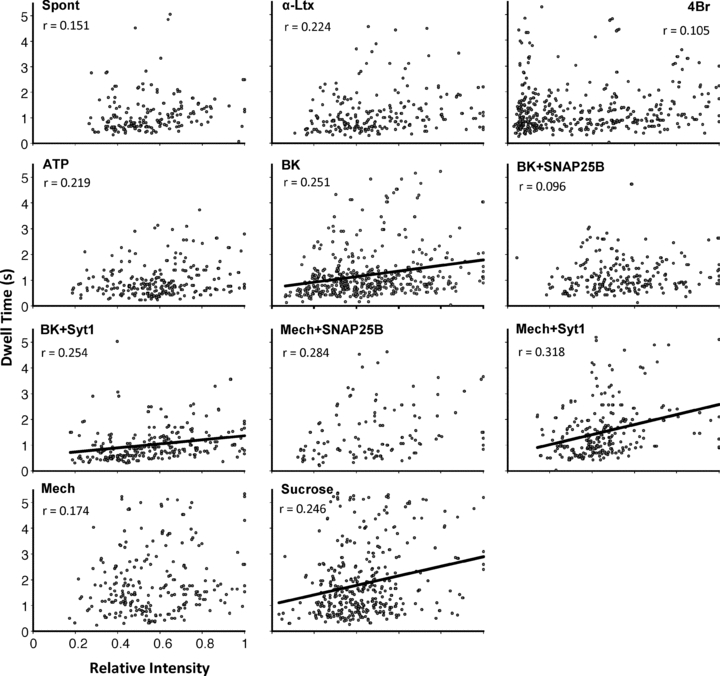
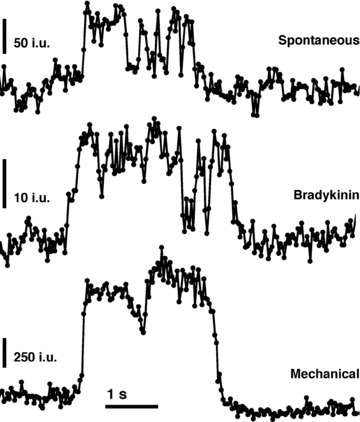
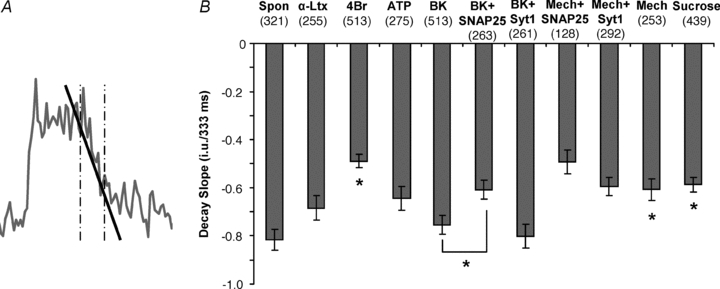
Astrocytes can release various gliotransmitters in response to stimuli that cause increases in intracellular Ca(2+) levels; this secretion occurs via a regulated exocytosis pathway. Indeed, astrocytes express protein components of the vesicular secretory apparatus. However, the detailed temporal characteristics of vesicular fusions in astrocytes are not well understood. In order to start addressing this issue, we used total internal reflection fluorescence microscopy (TIRFM) to visualize vesicular fusion events in astrocytes expressing the fluorescent synaptobrevin 2 derivative, synapto-pHluorin. Although our cultured astrocytes from visual cortex express synaptosome-associated protein of 23 kDa (SNAP23), but not of 25 kDa (SNAP25), these glial cells exhibited a slow burst of exocytosis under mechanical stimulation; the expression of SNAP25B did not affect bursting behaviour. The relative amount of two distinct types of events observed, transient and full fusions, depended on the applied stimulus. Expression of exogenous synaptotagmin 1 (Syt1) in astrocytes endogenously expressing Syt4, led to a greater proportion of transient fusions when astrocytes were stimulated with bradykinin, a stimulus otherwise resulting in more full fusions. Additionally, we studied the stability of the transient fusion pore by measuring its dwell time, relation to vesicular size, flickering and decay slope; all of these characteristics were secretagogue dependent. The expression of SNAP25B or Syt1 had complex effects on transient fusion pore stability in a stimulus-specific manner. SNAP25B obliterated the appearance of flickers and reduced the dwell time when astrocytes were mechanically stimulated, while astrocytes expressing SNAP25B and stimulated with bradykinin had a reduction in decay slope. Syt1 reduced the dwell time when astrocytes were stimulated either mechanically or with bradykinin. Our detailed study of temporal characteristics of astrocytic exocytosis will not only aid the general understanding of this process, but also the interpretation of the events at the tripartite synapse, both in health and disease.


Figures

Figure 2
Figure 2. Synapto-pHluorin reveals exocytotic events in astrocytes
A, TIRF image of a spH-expressing astrocyte showing vesicular fusion events before and after stimulation with the Ca2+ ionophore 4-Br-A23187 (20 μm). B, co-expressing the light chain of tetanus toxin with spH in astrocytes resulted in a decrease in the number of fusions observed, spontaneously or stimulated by 4-Br-A23187 or bradykinin (*P < 0.05, **P < 0.01; Mann–Whitney U test). Graphs represent the median and the range of the number of fusions counted. Numbers in parentheses indicate the number of cells in each group. C, TIRF images of an astrocyte expressing spH before (left) and after (right) incubation with 1 μm bafilomycin A1 for 30 min. This ‘alkaline trapping’ dispels the proton gradient inside vesicles, removing the quench of spH. D, quantification of the bafilomycin A1 effect on spH fluorescence, shown as mean ± SEM of positive pixels per cell (n = 6; paired t test; **P < 0.01).
Figure 1
Figure 1. Size estimate of synaptobrevin 2-containing vesicles in live astrocytes
A, total internal reflection fluorescence microscopy (TIRFM). A laser beam is totally reflected off the interface between the coverslip and cell when the incident angle (73 deg in our experiments) exceeds a critical angle (62–66 deg in our experiments). A portion of the radiation, called the evanescent wave, continues across the interface but its intensity decays exponentially (a penetration depth of 70–77 nm in our experiments). TIRFM takes advantage of the evanescent field to illuminate fluorophores only within ∼100 nm of the coverslip, while fluorophores above this range will not be excited. Angles and objects are not to scale. B, images of 500 nm fluorescent beads (upper) and vesicles in astrocytes labelled with GFP appended to synaptobrevin 2 (VAMP2-GFP, lower) viewed with the illuminating laser in TIRF mode (left) and obliquely adjusted to penetrate the entire sample depth (right). C, inset illustrates how only portions of the larger beads/objects would be illuminated in TIRF mode. Using the ratio of the intensity of beads of various sizes, imaged when obliquely and TIRF illuminated, a standard curve was constructed which is described by an exponential equation (x, diameter; y, ratio). The same ratio was obtained for VAMP2-GFP-containing vesicles in astrocytes; plotting this vesicle ratio onto the curve gives an estimate of the diameter of the vesicles in astrocytes of ∼312 nm on average (dotted line). Points indicate means ± SD. The shaded area represents the range of vesicle sizes observed. Arrow indicates calculated penetration depth of TIRF evanescent field.
Figure 3
Figure 3. Time course of vesicular fusions and global intracellular Ca2+ in astrocytes
Astrocytes (illuminated using TIRF/evanescence wave) display spontaneous fusion events (A) over an extended period with fusions occurring relatively consistently throughout the period. Similar time courses were observed with the majority of stimuli (BE, G). While stimulation with bradykinin showed an initial acceleration of vesicle fusion (B), mechanical contact was the only stimulus that elicited a bona fide exocytotic burst (F). Upper plots of each panel (AG) show average number of spH fusions detected per second (grey bars) and average cumulative fusions over the entire period (black trace) that occurred under the various conditions. Note that for a more relevant comparison with stimulated cells in respect to the mode of fusion (see below), we selected a subset of the more active cells to display spontaneous vesicular fusions in A. Lower plots illustrate average of global cytoplasmic Ca2+ activity measured within astrocytes (illuminated by epi-fluorescence) in response to the same stimulation used to elicit fusions; traces show mean fluo-3 fluorescence ± SEM as dF/Fo (%). The fluorescence intensity of EGFP was monitored in a set of cells exposed to sucrose stimulation to account for any change in fluo-3 fluoresence due to cell volume change because of hypertonicity (G, lower right chart). The number of cells in each group is indicated on each chart (n). All stimuli (or sham in A) were delivered starting 30 s after the beginning of recording (arrows indicated only in A, and subsequently omitted for simplicity) and lasting until the end of the experiment (4.5 min), with the exception of mechanical stimulation that was delivered transiently (lasting ∼1 s).
Figure 4
Figure 4. Expression of SNAP25B in astrocytes does not induce an exocytotic burst
A, verification of the expression of exogenous SNAP25B and its localization in cultured astrocytes. Transfected cells were identified by the expression of EGFP (top, FITC), while the expression of SNAP25B was assessed by labelling with an antibody (bottom, TRITC). It should be noted that due to the permeabilization procedure for indirect immunocytochemistry in some cells EGFP fluorescence can be diminished from the cytosolic compartment, leaving mainly perinuclear stain (top, compare left and right). Staining by the SNAP25 antibody was absent when cells were transfected with EGFP alone (SNAP25B −), but readily detectable in cells expressing exogenous SNAP25B (SNAP25B +). Scale bar: 10 μm. B, quantification of immunoreactivity expressed in fluorescence (F) intensity units (i.u.). We found no difference between TRITC fluorescence levels in cells transfected with EGFP alone regardless whether primary antibody was present. Bars represent means ± SEMs of measurements. Numbers in parentheses indicate the number of cells in each group. Asterisks indicate a significant change of measurements compared with the control group (one-way ANOVA followed by post hoc Fisher's LSD test; **P < 0.01). C, plots showing average number of spH fusions detected per second (grey bars) and average cumulative fusions over the entire period (black trace) reveal that the expression of SNAP25B in astrocytes does not induce a bursting phenotype in cells stimulated with bradykinin, while bursting was still seen with mechanical contact. The number of astrocytes in each group is indicated on each chart (n).
Figure 5
Figure 5. Detection of transient and full forms of vesicular fusion in astrocytes
A, monitoring fusion events at 16.6 ms acquisition rate. Potential fusions were detected as bright spots where the intensity exceeded 3 standard deviations (SD) above the mean intensity of the image. The average intensities of 2 concentric circular regions with diameters of 1.382 μm and 0.691 μm (20 and 10 pixels, respectively) centred over each site were measured. A fusion was counted when the intensity in the centre circle exceeds the mean +3 SD. If the outer ring surpassed the mean + 3 SD, the fusion was considered a full fusion, otherwise it was considered a transient fusion. In subsequent experiments the profile of intensity of the centre region alone was used to determine fusion type (see text). B, representative trace of a fusion event displaying transient (kiss-and-run) characteristics. The intensity increases predominately in the inner region (trace, black circles) while intensity in the outer ring (trace, white circles) remains relatively unchanged. This is consistent with the vesicle having a transient fusion pore with the plasma membrane (drawing; arrow pointing down, fusion; arrow pointing up, vesicle retrieval from the plasma membrane). Across the top are images of this region: before fusion, when fusion initiated, during fusion, and afterwards. The times for each image are indicated by arrowheads on the trace. C, representative trace of a fusion event displaying full fusion characteristics. The intensity increases initially in the inner circle (trace, black circles) followed by an increase of intensity in the outer ring (trace, white circles). This is consistent with the vesicle fully collapsing into the plasma membrane (drawing, arrow) and spH fluorescence diffusing over a large area of the plasma membrane. Across the top are images of this region: before fusion, when fusion initiated, during the fusion, and afterwards. The times for each image are indicated by arrowheads on the trace. D, line-scan plots showing spread of fluorescence during fusion events. A 1.382 μm line was drawn through the centres of potential fusion sites and the fluorescence intensity at each pixel along this line was recorded for each frame of the fusion event. E, averaged line-scan traces from 131 transient fusion events from an astrocyte stimulated with 4-Br-A23187. Each trace (1–10) was taken 333 ms apart; some have been omitted for clarity. The corresponding chart shows the full-width half-maximum (FWHM) for each trace over time. The peak fluorescence (trace 1; initial point) occurred immediately after fusion. Subsequent traces do not get wider, nor does the FWHM increase appreciably, indicating that the fluorescence is contained after fusion, consistent with transient fusion type. F, averaged line-scans through the centres of 347 full fusions from the same cell as in E. Traces and charts made as in E. Traces after the peak (trace 1) become wider indicating an outward spread of fluorescence from the site of fusion, as quantified by the increasing values of FWHM in the chart, consistent with full fusion type.
Figure 6
Figure 6. Preferred fusion type in astrocytes is stimulus dependent
A, the number events categorized as either transient or full fusions were plotted as a percentage of the total number of fusions that occurred, either spontaneously or when astrocytes were stimulated as in Fig. 3A. Bars represent means ± SEM of the proportion (in percentage) of each fusion type in individual astrocytes; values in parentheses are: (number of cells, total number of events). B, the peak fluorescence intensities of transient (left) and full fusion (right) events in astrocyte stimulated with bradykinin are shown as dF/Fo plotted in histograms. The intensity distributions of both fusion types are unimodal (back curve) indicating that the vesicles involved belong to a single population. C, plots showing the total number of fusions per second (grey bars) and the total cumulative fusions (black trace) occurring over the course of the experiment using cells in A; transient (left) and full fusion events (right) are plotted separately. Both fusion types occur throughout the entire time of the experiment.
Figure 7
Figure 7. Expression of Syt1 in astrocytes does not affect the temporal pattern of fusions
A, verification of the expression of synaptotagmin 1 (Syt1) and its localization in cultured astrocytes. Transfected cells were identified by the expression of EGFP (top), while the expression of exogenous Syt1 (Syt1+) was confirmed by labelling with an antibody (bottom). Staining by the Syt1 antibody was absent when cells were transfected with EGFP alone (Syt1−). Scale bar, 10 μm. B, quantification of immunoreactivity expressed in fluorescence (F) intensity units (i.u.). Bars represent means ± SEMs of measurements. We found no difference between TRITC fluorescence levels in cells transfected with EGFP alone (control) regardless of whether primary antibody was present. Asterisks indicate a significant change of measurements compared with the control group (**P < 0.01, one-way ANOVA followed by post hoc Fisher's LSD test). Numbers in parentheses indicate the number of cells in each group. C, plots showing average number of spH fusions detected per second (grey bars) and average cumulative fusions over the entire period (black trace) reveal that the expression of Syt1 in astrocytes does not affect bursting with mechanical contact or the sustained phenotype in cells stimulated with bradykinin.
Figure 8
Figure 8. The effects of expression of exogenous SNAP25B or synaptotagmin 1 on vesicle fusion type in astrocytes
The events categorized as either transient or full fusions were calculated as the average proportion (%) of the total number of fusions that occurred with individual astrocytes stimulated by either bradykinin (1 μm) or mechanical contact (replotted from Fig. 6A), or when these two stimuli were used in cells expressing (+) either SNAP25B or Syt1. SEMs are the same for both types of fusion. *P < 0.05, one-way ANOVA followed by post hoc Fisher's LSD test.
Figure 9
Figure 9. The open time of the fusion pore (dwell time) of transient fusion events in astrocytes
A, the time each transient fusion event spent in close proximity to the plasma membrane after fusion, without vesicular internalization/re-acidification, was estimated by measuring the full-width half-maximum intensity (dwell time, dashed line) for each event (number of events shown in parentheses). This approximates the open time of the fusion pore during these events. B, average duration of dwell time. Mechanical and sucrose stimulation resulted in significantly longer pore open times. The expression of SNAP25B or Syt1 resulted in a shortening of the open time during mechanical stimulation. However, under bradykinin stimulation only Syt1 shortened the open time. *P < 0.05, **P < 0.01; Kruskal–Wallis one-way ANOVA followed by post hoc Dunn's test. Abbreviations: Spon, spontaneous; α-Ltx, α-latrotoxin; 4Br, 4-Br-A231887; BK, bradykinin; Mech, mechanical.
Figure 10
Figure 10. The relationship between the relative vesicle size and the duration (dwell time) of transient fusions
Graphs of the normalized fluorescence intensity of spH-containing vesicles that underwent transient fusion vs. the (dwell) time the vesicle maintained an open pore after fusion with the plasma membrane. The intensities are normalized to the brightest vesicle in each cell/experiment. This relative intensity is used as an estimate of the relative vesicle size. The time is measured as the full-width half-maximum intensity for each transient event as in Fig. 9. Lines represent significant linear relationships (significance established using regression ANOVA at P < 0.0001) given by the equation (dwell time (y) = slope* normalized (relative) spH fluorescence (x) + intercept); r, correlation coefficient of a given relationship. Abbreviations as in Fig. 9.
Figure 11
Figure 11. Transient fusions can display flickering
Traces represent examples of transient fusions that displayed variability in the spH fluorescence intensity (i.u.) of their plateau phase. This change in intensity probably reflects temporal variations in the fusion pore size, and hence its instability, while the vesicle is still associated with the membrane. These flickering events were observed in spontaneous transient fusions, as well as those evoked with all the different stimuli (see Table 4).
Figure 12
Figure 12. Decay slope of transient fusion events in astrocytes
A, the average slope (black line) of fluorescence decay within a time window of 333 ms (vertical dotted lines) centred at half-maximal fluorescence intensity of the decay phase of each transient fusion was measured. This approximates the rate of the vesicular internalization/re-acidification process in transiently fusing vesicles. B, the average slope is given as the change in fluorescence intensity units (i.u.) per 333 ms time widow. 4-Br-A23187, mechanical and sucrose stimulation resulted in significantly reduced slopes. The expression of SNAP25B resulted in a reduction of the slope during stimulation with bradykinin (*P < 0.05, Kruskal–Wallis one-way ANOVA followed by post hoc Dunn's test). Abbreviations as in Fig. 9.
Figure 13
Figure 13. Estimate of post-fusion diffusion of vesicular synaptobrevin 2 within the plasma membrane
A, averaged time course of full fusion spH fluorescence intensity decay; astrocytes were stimulated with bradykinin. When fitted to eqn (1), the time constant, τ, of the decay rate can be estimated. The diffusion coefficient, D, of the movement of spH, a synaptobrevin 2 derivative, in the plasma membrane can be estimated using eqn (2) (see text for details). B, table shows the time constant and diffusion coefficient for each condition; number of full fusion events used in calculations is shown in parentheses.

Similar articles

Cited by

References

    1. Ahmari SE, Buchanan J, Smith SJ. Assembly of presynaptic active zones from cytoplasmic transport packets. Nat Neurosci. 2000;3:445–451. - PubMed
    1. Ales E, Tabares L, Poyato JM, Valero V, Lindau M, Alvarez de Toledo G. High calcium concentrations shift the mode of exocytosis to the kiss-and-run mechanism. Nat Cell Biol. 1999;1:40–44. - PubMed
    1. Araque A, Parpura V, Sanzgiri RP, Haydon PG. Tripartite synapses: glia, the unacknowledged partner. Trends Neurosci. 1999;22:208–215. - PubMed
    1. Aravanis AM, Pyle JL, Tsien RW. Single synaptic vesicles fusing transiently and successively without loss of identity. Nature. 2003;423:643–647. - PubMed
    1. Atluri PP, Ryan TA. The kinetics of synaptic vesicle reacidification at hippocampal nerve terminals. J Neurosci. 2006;26:2313–2320. - PMC - PubMed

Publication types

Substances

LinkOut - more resources