Enhanced high-frequency membrane potential fluctuations control spike output in striatal fast-spiking interneurones in vivo
- PMID: 21746788
- PMCID: PMC3180588
- DOI: 10.1113/jphysiol.2011.212944
Enhanced high-frequency membrane potential fluctuations control spike output in striatal fast-spiking interneurones in vivo
Abstract
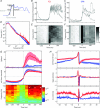
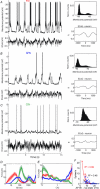
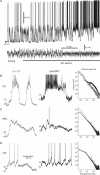
Fast-spiking interneurones (FSIs) constitute a prominent part of the inhibitory microcircuitry of the striatum; however, little is known about their recruitment by synaptic inputs in vivo. Here, we report that, in contrast to cholinergic interneurones (CINs), FSIs (n = 9) recorded in urethane-anaesthetized rats exhibit Down-to-Up state transitions very similar to spiny projection neurones (SPNs). Compared to SPNs, the FSI Up state membrane potential was noisier and power spectra exhibited significantly larger power at frequencies in the gamma range (55-95 Hz). The membrane potential exhibited short and steep trajectories preceding spontaneous spike discharge, suggesting that fast input components controlled spike output in FSIs. Spontaneous spike data contained a high proportion (43.6 ± 32.8%) of small inter-spike intervals (ISIs) of <30 ms, setting FSIs clearly apart from SPNs and CINs. Cortical-evoked inputs had slower dynamics in SPNs than FSIs, and repetitive stimulation entrained SPN spike output only if the stimulation was delivered at an intermediate frequency (20 Hz), but not at a high frequency (100 Hz). Pharmacological induction of an activated ECoG state, known to promote rapid FSI spiking, mildly increased the power (by 43 ± 55%, n = 13) at gamma frequencies in the membrane potential of SPNs, but resulted in few small ISIs (<30 ms; 4.3 ± 6.4%, n = 8). The gamma frequency content did not change in CINs (n = 8). These results indicate that FSIs are uniquely responsive to high-frequency input sequences. By controlling the spike output of SPNs, FSIs could serve gating of top-down signals and long-range synchronisation of gamma-oscillations during behaviour.
Figures


Similar articles
-
Excitatory extrinsic afferents to striatal interneurons and interactions with striatal microcircuitry.Eur J Neurosci. 2019 Mar;49(5):593-603. doi: 10.1111/ejn.13881. Epub 2018 Mar 25. Eur J Neurosci. 2019. PMID: 29480942 Free PMC article. Review.
-
A tonic nicotinic brake controls spike timing in striatal spiny projection neurons.Elife. 2022 May 17;11:e75829. doi: 10.7554/eLife.75829. Elife. 2022. PMID: 35579422 Free PMC article.
-
Representation of the body in the lateral striatum of the freely moving rat: Fast Spiking Interneurons respond to stimulation of individual body parts.Brain Res. 2017 Feb 15;1657:101-108. doi: 10.1016/j.brainres.2016.11.033. Epub 2016 Nov 30. Brain Res. 2017. PMID: 27914882 Free PMC article.
-
Feedforward inhibition of projection neurons by fast-spiking GABA interneurons in the rat striatum in vivo.J Neurosci. 2005 Apr 13;25(15):3857-69. doi: 10.1523/JNEUROSCI.5027-04.2005. J Neurosci. 2005. PMID: 15829638 Free PMC article.
-
Dopamine-modulated dynamic cell assemblies generated by the GABAergic striatal microcircuit.Neural Netw. 2009 Oct;22(8):1174-88. doi: 10.1016/j.neunet.2009.07.018. Epub 2009 Jul 19. Neural Netw. 2009. PMID: 19646846 Review.
Cited by
-
Excitatory extrinsic afferents to striatal interneurons and interactions with striatal microcircuitry.Eur J Neurosci. 2019 Mar;49(5):593-603. doi: 10.1111/ejn.13881. Epub 2018 Mar 25. Eur J Neurosci. 2019. PMID: 29480942 Free PMC article. Review.
-
Nucleus accumbens local circuit for cue-dependent aversive learning.Cell Rep. 2023 Dec 26;42(12):113488. doi: 10.1016/j.celrep.2023.113488. Epub 2023 Nov 22. Cell Rep. 2023. PMID: 37995189 Free PMC article.
-
A biologically constrained spiking neural network model of the primate basal ganglia with overlapping pathways exhibits action selection.Eur J Neurosci. 2021 Apr;53(7):2254-2277. doi: 10.1111/ejn.14869. Epub 2020 Jul 3. Eur J Neurosci. 2021. PMID: 32564449 Free PMC article.
-
Frequency-dependent entrainment of striatal fast-spiking interneurons.J Neurophysiol. 2019 Sep 1;122(3):1060-1072. doi: 10.1152/jn.00369.2019. Epub 2019 Jul 17. J Neurophysiol. 2019. PMID: 31314645 Free PMC article.
-
Deep brain stimulation in the subthalamic nucleus for Parkinson's disease can restore dynamics of striatal networks.Proc Natl Acad Sci U S A. 2022 May 10;119(19):e2120808119. doi: 10.1073/pnas.2120808119. Epub 2022 May 2. Proc Natl Acad Sci U S A. 2022. PMID: 35500112 Free PMC article.
References
-
- Bartos M, Vida I, Jonas P. Synaptic mechanisms of synchronized gamma oscillations in inhibitory interneuron networks. Nat Rev Neurosci. 2007;8:45–56. - PubMed
-
- Berke JD, Okatan M, Skurski J, Eichenbaum HB. Oscillatory entrainment of striatal neurons in freely moving rats. Neuron. 2004;43:883–896. - PubMed
MeSH terms
LinkOut - more resources
Full Text Sources

