. 2011 Aug 1;208(8):1649-60.
doi: 10.1084/jem.20110118. Epub 2011 Jul 11.

Epigenetic tethering of AID to the donor switch region during immunoglobulin class switch recombination

Affiliations

Epigenetic tethering of AID to the donor switch region during immunoglobulin class switch recombination

Beena Patricia Jeevan-Raj et al. J Exp Med. .

Abstract

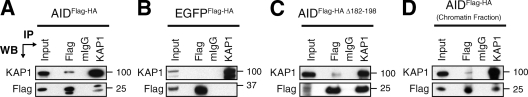
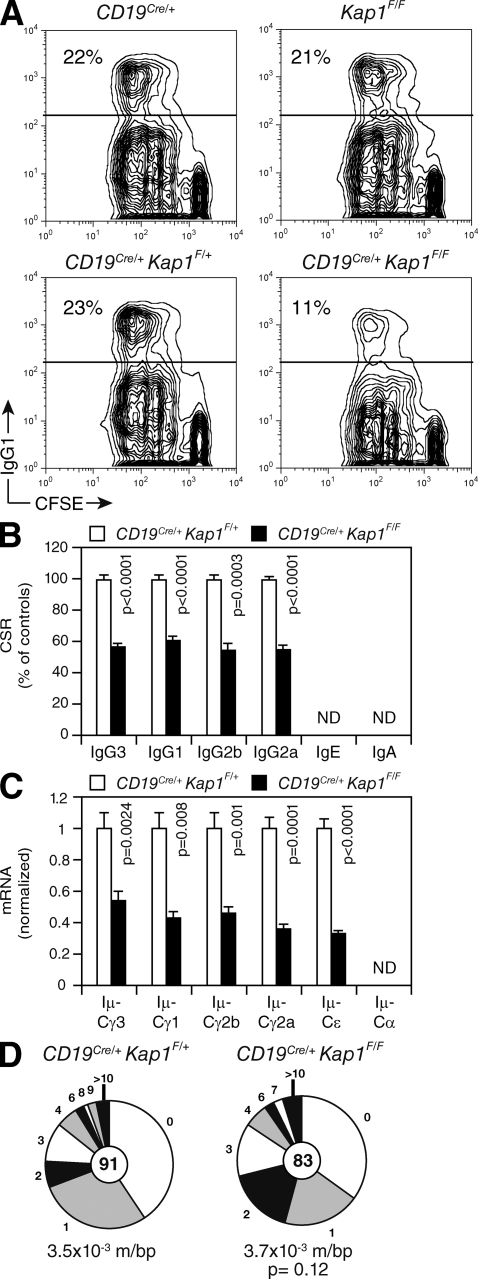
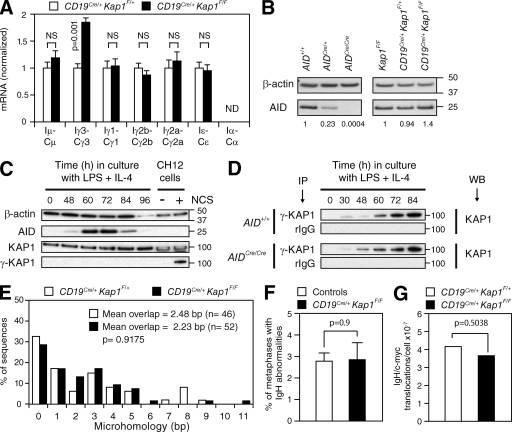
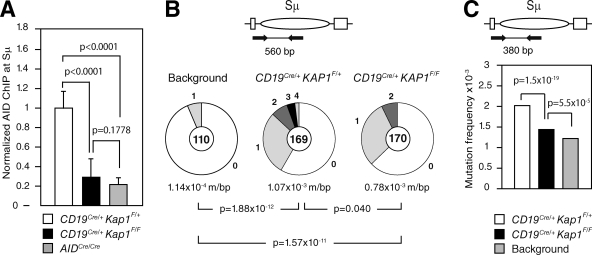
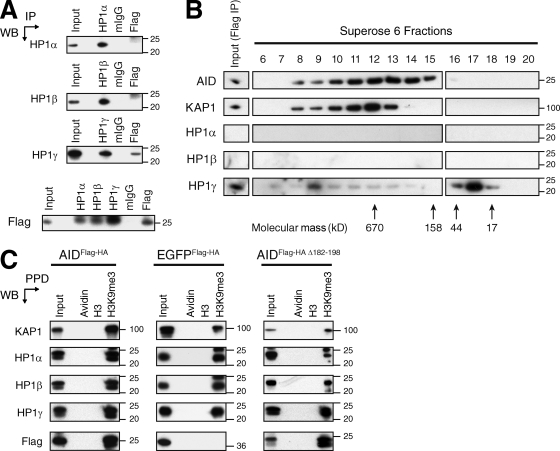
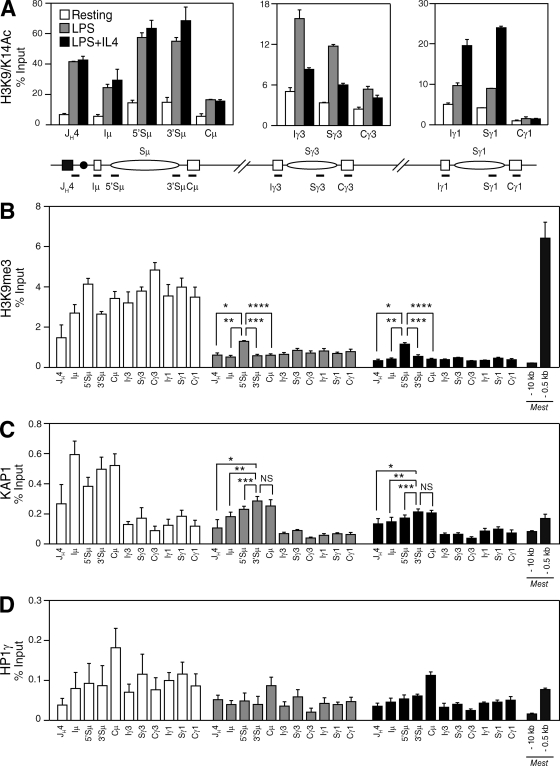
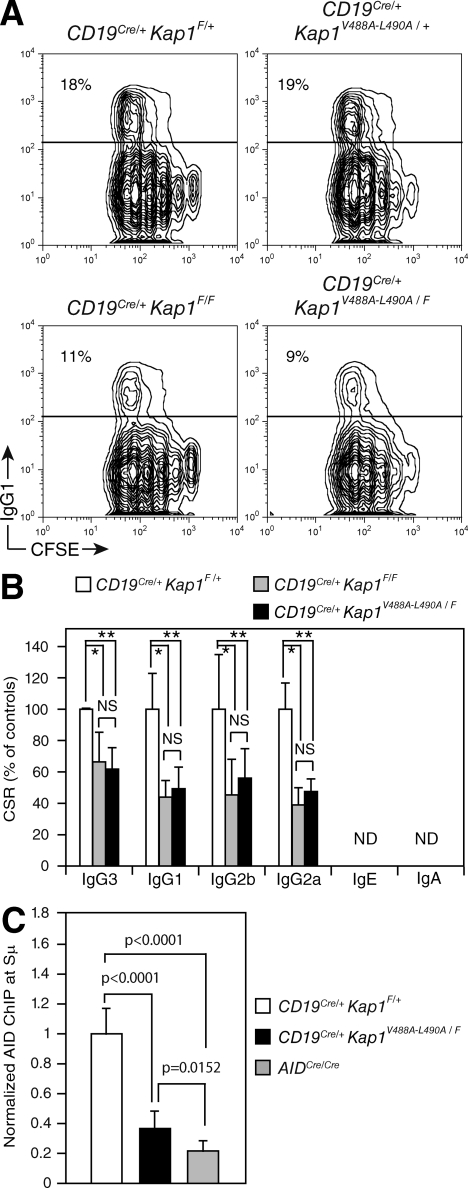
Immunoglobulin class switch recombination (CSR) is initiated by double-stranded DNA breaks (DSBs) in switch regions triggered by activation-induced cytidine deaminase (AID). Although CSR correlates with epigenetic modifications at the IgH locus, the relationship between these modifications and AID remains unknown. In this study, we show that during CSR, AID forms a complex with KAP1 (KRAB domain-associated protein 1) and HP1 (heterochromatin protein 1) that is tethered to the donor switch region (Sμ) bearing H3K9me3 (trimethylated histone H3 at lysine 9) in vivo. Furthermore, in vivo disruption of this complex results in impaired AID recruitment to Sμ, inefficient DSB formation, and a concomitant defect in CSR but not in somatic hypermutation. We propose that KAP1 and HP1 tether AID to H3K9me3 residues at the donor switch region, thus providing a mechanism linking AID to epigenetic modifications during CSR.


Figures

Figure 1.
Figure 1.
KAP1 associates with AID. (A–C) Nuclear extracts prepared from CH12 cells stably expressing AIDFlag-HA (A), EGFPFlag-HA (B), or AIDFlag-HA Δ182–198 (C) were immunoprecipitated and blotted with anti-KAP1 and anti-Flag antibodies. Because of the lower expression levels of AIDFlag-HA Δ182–198 when compared with AIDFlag-HA or EGFPFlag-HA (Fig. S1), loading for Western blot (WB) analysis was adjusted accordingly in C. (D) Chromatin fractions prepared from CH12 cells expressing AIDFlag-HA were immunoprecipitated and blotted with anti-KAP1 and anti-Flag antibodies. Input control represents 1% of material used for immunoprecipitation (IP). Molecular mass markers in kilodaltons are indicated. Data are representative of five independent experiments.
Figure 2.
Figure 2.
KAP1 is required for efficient CSR but is dispensable for SHM. (A) IgG1 surface expression and CFSE dilution by flow cytometry in CD19Cre/+, Kap1F/F, CD19Cre/+Kap1F/+, and CD19Cre/+Kap1F/F B cells stimulated with LPS + IL-4 for 72 h. The percentage of switched cells is indicated in each plot. (B) Percentage (+SD) of CSR after 72 h in CD19Cre/+Kap1F/F relative to CD19Cre/+Kap1F/+ for the different isotypes tested (CSR to IgA and IgE could not be determined). CSR in CD19Cre/+Kap1F/+ B cells was set to 100%. Data are from five independent experiments. (C) qRT-PCR for postswitch (Iμ-CH) transcripts in CD19Cre/+Kap1F/F relative to CD19Cre/+Kap1F/+ stimulated B cells (72 h). Expression is normalized to Cd79b expression and is presented relative to the expression in CD19Cre/+Kap1F/+ B cells, set as 1. Data are representative of three experiments. Error bars indicate SD. (D) JH4 intron sequences from germinal center B cells (B220+Fas+GL-7+) sorted from the lymph nodes of immunized CD19Cre/+Kap1F/F and CD19Cre/+Kap1F/+ mice were analyzed for mutations. Segment sizes are proportional to the number of sequences bearing the indicated mutations. Mutation frequency (mutations/base pair [m/bp]) and number of sequences analyzed (in center) are indicated. Sequences were obtained from four independent experiments. (B–D) P-values were determined by the Student’s t test.
Figure 3.
Figure 3.
KAP1 functions downstream of switch region transcription and upstream of DSB formation. (A) qRT-PCR for germline (IH-CH) transcripts in CD19Cre/+Kap1F/F relative to CD19Cre/+Kap1F/+ stimulated B cells (72 h). Expression is normalized to Cd79b and relative to CD19Cre/+Kap1F/+ B cells, set as 1. P-values were determined by the Student’s t test. Data are from three independent experiments. Error bars indicate SD. (B) Western blot for AID and β-actin in Kap1F/F, CD19Cre/+Kap1F/+, CD19Cre/+Kap1F/F, AID+/+, AIDCre/+, and AID-deficient (AIDCre/Cre) B cells. Numbers below the panel reflect the intensity of bands representing AID protein levels relative to controls after normalization to β-actin. Molecular mass markers in kilodaltons are indicated. Data are representative of three independent experiments. (C) KAP1 phosphorylation (γ-KAP1) by Western blot in wild-type B cells cultured with LPS + IL-4. As a positive control, CH12 cells treated with neocarzinostatin (NCS). (D) γ-KAP1 was immunoprecipitated from activated AID+/+ and AID-deficient (AIDCre/Cre) B cells and blotted for KAP1. Data are representative of two independent experiments. IP, immunoprecipitation; WB, Western blot. (E) Percentage of Sμ/Sγ3 switch junction sequences with indicated nucleotide overlap from CD19Cre/+Kap1F/+ and CD19Cre/+Kap1F/F LPS-stimulated B cells (72 h) from five independent experiments. Mean length of overlap in base pairs and the number of sequences analyzed (n) is indicated. (F) Quantification of IgH locus breaks as determined by IgH-FISH on metaphases prepared from control (n = 780) and CD19Cre/+Kap1F/F (n = 593) B cells cultured for 3 d with anti-CD40 and IL-4. Mean (+SEM) is shown. Data are from two independent experiments (Table S1). (E and F) P-values were determined by the Mann-Whitney test. (G) Frequency of IgH/c-myc translocations in CD19Cre/+Kap1F/F and CD19Cre/+Kap1F/+ B cells determined by long-range PCR and Southern blot in three independent experiments. The p-value was determined by the one-tailed exact Fisher’s test.
Figure 4.
Figure 4.
AID binding to Sμ is impaired by Kap1 deficiency and results in reduced levels of DNA damage. (A) ChIP analysis for AID occupancy at the Sμ switch region in CD19Cre/+Kap1F/+, CD19Cre/+Kap1F/F, and AIDCre/Cre B cells cultured in vitro with LPS + IL-4 for 60 h. Normalized AID-ChIP data from three experiments assayed with two different primer sets are shown. For each sample, AID-ChIP values were normalized to the input control and subtracted from the bead-only negative control. AID-ChIP signal in CD19Cre/+Kap1F/+ B cells was assigned an arbitrary value of 1. P-values were determined by the one-tailed Student’s t test. Error bars indicate SD. (B and C) Mutation analysis in the 5′ end of Sμ in CD19Cre/+Kap1F/F and CD19Cre/+Kap1F/+ LPS + IL-4–stimulated B cells (72 h) as determined by Sanger sequencing (B) or HTS (C). Data are from five and four independent experiments, respectively. Background mutation frequency was determined on tail genomic DNA. Pie charts in B are as in Fig. 2. P-values were determined by the two-tailed Student’s t test.
Figure 5.
Figure 5.
AID forms a complex with KAP1 and HP1 that binds H3K9me3. (A) Nuclear extracts prepared from CH12 cells expressing AIDFlag-HA were immunoprecipitated and blotted with anti–HP1-α, anti–HP1-β, anti–HP1-γ, and anti-Flag antibodies. Data are representative of three independent experiments. (B) Flag immunoprecipitates eluted with the Flag peptide were fractionated with a Superose 6 gel filtration column. The indicated fractions were analyzed by Western blot using antibodies specific for KAP1, HP1-α, HP1-β, HP1-γ, and AID. Arrows indicate the elution position of calibration proteins of known molecular mass. Data are representative of two independent experiments. (C) Peptide pull-downs (PPD) using biotinylated unmodified (H3) or modified H3 peptides (H3K9me3) and avidin-agarose beads (Avidin) on nuclear extracts prepared from CH12 cells stably expressing AIDFlag-HA, EGFPFlag-HA, or AIDFlag-HA Δ182–198. Precipitated proteins were separated by SDS-PAGE and blotted with antibodies specific for KAP1, HP1-α, HP1-β, HP1-γ, and Flag. Data are representative of three independent experiments. (A–C) Molecular mass markers in kilodaltons are indicated. IP, immunoprecipitation; WB, Western blot.
Figure 6.
Figure 6.
H3K9me3 and KAP1 mark the donor switch region (Sμ) before and during CSR. (A–D) ChIP analysis performed on chromatin prepared from resting or LPS-stimulated (48 h) and LPS + IL-4–stimulated (48 h) B cells obtained from CD19Cre/+Kap1F/+ mice using antibodies specific for H3K9/K14Ac (A), H3K9me3 (B), KAP1 (C), and HP1-γ (D). Real-time quantitative PCR was performed by using primer pairs specific for JH4, Iμ, Sμ, Cμ, Iγ3, Sγ3, Cγ3, Iγ1, Sγ1, and Cγ1. Regions surrounding the Mest promoter (−10 kb and −0.5 kb) were used as negative and positive controls, respectively (Riclet et al., 2009). Fold change over control IgG is expressed as a percentage of input. Mean (+SD) of triplicate samples is shown. P-values were determined by the one-tailed Student’s t test (H3K9me3, LPS: *, P = 0.0003; **, P < 0.0001; ***, P < 0.0001; ****, P < 0.0001; H3K9me3, LPS + IL-4: *, P < 0.0001; **, P = 0.0001; ***, P = 0.0004; ****, P < 0.0001; KAP1, LPS: *, P = 0.0040; **, P = 0.0065; ***, P = 0.0289; KAP1, LPS + IL-4: *, P = 0.0134; **, P = 0.0170; ***, P = 0.0346). See Tables S2 and S5 for detailed statistical analysis and primer sequences, respectively. Data are representative of four independent experiments (see Fig. S7 for an additional experiment).
Figure 7.
Figure 7.
The in vivo association between KAP1 and HP1 is required for efficient CSR. (A) IgG1 cell surface expression in CD19Cre/+Kap1F/+, CD19Cre/+ Kap1V488A-L490A/+, CD19Cre/+Kap1F/F, and CD19Cre/+ Kap1V488A-L490A/F CFSE-labeled B cells stimulated with LPS + IL-4 for 3 d. The percentage of switched cells is indicated in each plot. (B) Percentage (+SD) of CSR in CD19Cre/+Kap1F/+, CD19Cre/+Kap1F/F, and CD19Cre/+ Kap1V488A-L490A/F relative to CD19Cre/+Kap1F/+. CSR in CD19Cre/+Kap1F/+ B cells was set to 100%. Data are from five independent experiments. P-values were determined by the one-tailed Student’s t test (*, CD19Cre/+Kap1F/+ vs. CD19Cre/+Kap1F/F: IgG3, P = 0.0154; IgG1, P = 0.0035; IgG2b, P = 0.0264; IgG2a, P = 0.001; **, CD19Cre/+Kap1F/+ vs. CD19Cre/+Kap1V488A-L490A/F: IgG3, P = 0.0017; IgG1, P = 0.0036; IgG2b, P = 0.0276; IgG2a, P = 0.0004). (C) ChIP analysis for AID occupancy at the Sμ switch region in CD19Cre/+Kap1F/+, CD19Cre/+Kap1V488A-L490A/F, and AIDCre/Cre B cells cultured in vitro with LPS + IL-4 for 60 h. Normalized AID-ChIP data from three experiments assayed with two different primer sets are shown. For each sample, AID-ChIP values were normalized to the input control and subtracted from the bead-only negative control. AID-ChIP signal in CD19Cre/+Kap1F/+ B cells was assigned an arbitrary value of 1. P-values were determined by the one-tailed Student’s t test. Error bars indicate SD.

Similar articles

Cited by

References

    1. Bannister A.J., Zegerman P., Partridge J.F., Miska E.A., Thomas J.O., Allshire R.C., Kouzarides T. 2001. Selective recognition of methylated lysine 9 on histone H3 by the HP1 chromo domain. Nature. 410:120–124 10.1038/35065138 - DOI - PubMed
    1. Barreto V., Reina-San-Martin B., Ramiro A.R., McBride K.M., Nussenzweig M.C. 2003. C-terminal deletion of AID uncouples class switch recombination from somatic hypermutation and gene conversion. Mol. Cell. 12:501–508 10.1016/S1097-2765(03)00309-5 - DOI - PubMed
    1. Brar S.S., Watson M., Diaz M. 2004. Activation-induced cytosine deaminase (AID) is actively exported out of the nucleus but retained by the induction of DNA breaks. J. Biol. Chem. 279:26395–26401 10.1074/jbc.M403503200 - DOI - PubMed
    1. Cammas F., Mark M., Dollé P., Dierich A., Chambon P., Losson R. 2000. Mice lacking the transcriptional corepressor TIF1beta are defective in early postimplantation development. Development. 127:2955–2963 - PubMed
    1. Cammas F., Herzog M., Lerouge T., Chambon P., Losson R. 2004. Association of the transcriptional corepressor TIF1beta with heterochromatin protein 1 (HP1): an essential role for progression through differentiation. Genes Dev. 18:2147–2160 10.1101/gad.302904 - DOI - PMC - PubMed

Publication types

MeSH terms