. 2011 Oct;261(1):199-209.
doi: 10.1148/radiol.11101651. Epub 2011 Jul 11.

Hippocampal sclerosis in temporal lobe epilepsy: findings at 7 T¹

Affiliations

Hippocampal sclerosis in temporal lobe epilepsy: findings at 7 T¹

Thomas R Henry et al. Radiology. 2011 Oct.

Abstract

Purpose: To determine if ultrahigh-field-strength magnetic resonance (MR) imaging can be used to detect subregional hippocampal alterations.

Materials and methods: Subjects provided written consent to participate in this prospective institutional review board-approved HIPAA-compliant study. T1- and T2-weighted 7-T brain MR images were acquired in 11 healthy subjects and eight patients with temporal lobe epilepsy (TLE). In all subjects, images were qualitatively examined for evidence of hippocampal atrophy, signal change, and malrotation with the Bernasconi definition, and digitations of the hippocampal heads were counted (agreement was measured with the κ statistic). Data were analyzed quantitatively with manual subregional hippocampal body segmentation. Subregional data in individual subjects with TLE were compared with data in control subjects to detect deviation from the control range for volume measures on each side and with asymmetry indexes.

Results: All eight patients with TLE had hippocampal abnormalities on the epileptogenic side. Subregional analysis revealed selective lateral Ammon horn atrophy in six patients and diffuse Ammon horn and dentate gyrus atrophy in one patient. Paucity of hippocampal digitations occurred on the epileptogenic side in all patients with TLE and also on the contralateral side in three patients (interrater κ value, 0.80). Hippocampal malrotation was observed in three patients with TLE and four control subjects.

Conclusion: Ultrahigh-field-strength MR imaging permitted detection of selectively greater Ammon horn atrophy in patients with TLE and hippocampal sclerosis. Paucity of digitations is a deformity of the hippocampal head that was detected independent of hippocampal atrophy in patients with mesial TLE.


Figures

Figure 1:
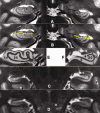
Figure 1:
Coronal T2-weighted MR images of, A, B, head of hippocampus in a control subject (31-year-old man) and, C, D, body of hippocampus in a patient with TLE (patient 5, 32-year-old man). On these and other coronal images, the subject’s right side is on the left side of the image. In B, anatomic correlates of the hippocampal digitation counting method are superimposed on the same 7-T images shown in A. Note the most superior points of hippocampal striation (∗) and the most inferior inflections of alveus (yellow lines). C, A 7-T MR image is located near, D, a 1.5-T fast spin-echo (repetition time msec/echo time msec, 6650/113; section thickness, 2 mm; 1 × 1-mm in-plane pixel size) MR image. Both C and D were obtained in the same patient. Each patient with TLE underwent 1.5- or 3-T MR imaging for clinical purposes; images were used only to select subjects for this study. E, F, Semischematic images show, E, head of right hippocampus (modified from A) and, F, body of left hippocampus (modified from C) and indicate likely anatomic correlates of corresponding MR images. 1 = CA1, 2 = CA2, 3 = CA3, 4 = CA4, CA = cornu ammonis, DG = dentate gyrus, S = subiculum, U = uncus.
Figure 2a:
Figure 2a:
Manual segmentation of two subregions of body of hippocampus on T2-weighted 7-T MR images in subject 2 (24-year-old man). (a, b) Most posterior coronal section in (a) head and (b) body of hippocampus, as the image on the left of these pairs. Red cross marks the same point on the paired coronal and sagittal images, and on sagittal section (as the image on the right of these pairs) indicates level of coronal section (front is on left side of sagittal image). (c) Limits of CA1–CA3 (dark blue) and CA4 and dentate gyrus (light blue) regions on coronal section in middle of body (with no colored subregions on left image and colored subregions on middle image, both showing the same image plane), as indicated on the sagittal section (right image). (d) Three-dimensional rendering of two subregions in body of hippocampus, displayed separately (left, with CA1–CA3 in dark blue, and middle, with CA4 and dentate gyrus in light blue) and together (right).
Figure 2b:
Figure 2b:
Manual segmentation of two subregions of body of hippocampus on T2-weighted 7-T MR images in subject 2 (24-year-old man). (a, b) Most posterior coronal section in (a) head and (b) body of hippocampus, as the image on the left of these pairs. Red cross marks the same point on the paired coronal and sagittal images, and on sagittal section (as the image on the right of these pairs) indicates level of coronal section (front is on left side of sagittal image). (c) Limits of CA1–CA3 (dark blue) and CA4 and dentate gyrus (light blue) regions on coronal section in middle of body (with no colored subregions on left image and colored subregions on middle image, both showing the same image plane), as indicated on the sagittal section (right image). (d) Three-dimensional rendering of two subregions in body of hippocampus, displayed separately (left, with CA1–CA3 in dark blue, and middle, with CA4 and dentate gyrus in light blue) and together (right).
Figure 2c:
Figure 2c:
Manual segmentation of two subregions of body of hippocampus on T2-weighted 7-T MR images in subject 2 (24-year-old man). (a, b) Most posterior coronal section in (a) head and (b) body of hippocampus, as the image on the left of these pairs. Red cross marks the same point on the paired coronal and sagittal images, and on sagittal section (as the image on the right of these pairs) indicates level of coronal section (front is on left side of sagittal image). (c) Limits of CA1–CA3 (dark blue) and CA4 and dentate gyrus (light blue) regions on coronal section in middle of body (with no colored subregions on left image and colored subregions on middle image, both showing the same image plane), as indicated on the sagittal section (right image). (d) Three-dimensional rendering of two subregions in body of hippocampus, displayed separately (left, with CA1–CA3 in dark blue, and middle, with CA4 and dentate gyrus in light blue) and together (right).
Figure 2d:
Figure 2d:
Manual segmentation of two subregions of body of hippocampus on T2-weighted 7-T MR images in subject 2 (24-year-old man). (a, b) Most posterior coronal section in (a) head and (b) body of hippocampus, as the image on the left of these pairs. Red cross marks the same point on the paired coronal and sagittal images, and on sagittal section (as the image on the right of these pairs) indicates level of coronal section (front is on left side of sagittal image). (c) Limits of CA1–CA3 (dark blue) and CA4 and dentate gyrus (light blue) regions on coronal section in middle of body (with no colored subregions on left image and colored subregions on middle image, both showing the same image plane), as indicated on the sagittal section (right image). (d) Three-dimensional rendering of two subregions in body of hippocampus, displayed separately (left, with CA1–CA3 in dark blue, and middle, with CA4 and dentate gyrus in light blue) and together (right).
Figure 3:
Figure 3:
Coronal T2-weighted 7-T MR images through the, A, B, head, C, body, and, D, tail of hippocampus in four control subjects (31-year-old man, 24-year-old woman, 19-year-old woman, and 22-year-old man, respectively) show internal structure of hippocampus. Hippocampal striation (arrows) was visible in all.
Figure 4:
Figure 4:
Coronal T2-weighted 7-T MR images through, A, head and, BD, body of hippocampus in three patients. A, Patient 1 (30-year-old woman). Absence of hippocampal digitations bilaterally and slightly increased signal intensity in head of right hippocampus. Hippocampal striation was barely visible in head of right hippocampus (arrows). B, Body of left hippocampus in patient 1 (arrow) had an unusual malrotated vertical shape. C, Patient 3 (22-year-old man). Hippocampal atrophy and increased signal intensity predominating in CA4 and dentate gyrus region in body of left hippocampus (arrow). D, Patient 8 (29-year-old woman) had hippocampal atrophy and increased signal intensity predominating in CA1–3 region in body of the left hippocampus (arrow). This patient also had globular hippocampal shape.
Figure 5:
Figure 5:
Manually segmented volumes of the two subregions of body of hippocampus (CA1–3 [dark blue] and CA4 and dentate gyrus [light blue]) in four control subjects (h2, h3, h1, and h10) and four patients with epilepsy (t3, t5, t6, and t8) in the slightly oblique coronal view, with the left side of the brain on right side of the image. Images in subjects 1 and 10 show unilateral malrotation of the hippocampus. Image in patient 3 shows left HS, image in patient 5 shows right HS, and images in patients 6 and 8 show left HS with malrotation of hippocampus.
Figure 6a:
Figure 6a:
(a–e) Graphs of hippocampal subregional volumetric data. DG = dentate gyrus. Paired graphs for each measurement show data by side in the left graph, and AI data in the right graph. Healthy subjects’ values are pooled in a single column to the left of each graph, with each patient’s data displayed separately. Horizontal lines facilitate comparison of values in patients with TLE with the range of values in the control group. For data by side, the lowest value in the control group is indicated by a color-coded dotted line for side, except in c and d, in which one line appears because right and left sides had the same lowest values in the control group; for AI data, a pair of solid horizontal lines indicates highest and lowest values in control group.
Figure 6b:
Figure 6b:
(a–e) Graphs of hippocampal subregional volumetric data. DG = dentate gyrus. Paired graphs for each measurement show data by side in the left graph, and AI data in the right graph. Healthy subjects’ values are pooled in a single column to the left of each graph, with each patient’s data displayed separately. Horizontal lines facilitate comparison of values in patients with TLE with the range of values in the control group. For data by side, the lowest value in the control group is indicated by a color-coded dotted line for side, except in c and d, in which one line appears because right and left sides had the same lowest values in the control group; for AI data, a pair of solid horizontal lines indicates highest and lowest values in control group.
Figure 6c:
Figure 6c:
(a–e) Graphs of hippocampal subregional volumetric data. DG = dentate gyrus. Paired graphs for each measurement show data by side in the left graph, and AI data in the right graph. Healthy subjects’ values are pooled in a single column to the left of each graph, with each patient’s data displayed separately. Horizontal lines facilitate comparison of values in patients with TLE with the range of values in the control group. For data by side, the lowest value in the control group is indicated by a color-coded dotted line for side, except in c and d, in which one line appears because right and left sides had the same lowest values in the control group; for AI data, a pair of solid horizontal lines indicates highest and lowest values in control group.
Figure 6d:
Figure 6d:
(a–e) Graphs of hippocampal subregional volumetric data. DG = dentate gyrus. Paired graphs for each measurement show data by side in the left graph, and AI data in the right graph. Healthy subjects’ values are pooled in a single column to the left of each graph, with each patient’s data displayed separately. Horizontal lines facilitate comparison of values in patients with TLE with the range of values in the control group. For data by side, the lowest value in the control group is indicated by a color-coded dotted line for side, except in c and d, in which one line appears because right and left sides had the same lowest values in the control group; for AI data, a pair of solid horizontal lines indicates highest and lowest values in control group.
Figure 6e:
Figure 6e:
(a–e) Graphs of hippocampal subregional volumetric data. DG = dentate gyrus. Paired graphs for each measurement show data by side in the left graph, and AI data in the right graph. Healthy subjects’ values are pooled in a single column to the left of each graph, with each patient’s data displayed separately. Horizontal lines facilitate comparison of values in patients with TLE with the range of values in the control group. For data by side, the lowest value in the control group is indicated by a color-coded dotted line for side, except in c and d, in which one line appears because right and left sides had the same lowest values in the control group; for AI data, a pair of solid horizontal lines indicates highest and lowest values in control group.

Similar articles

Cited by

References

    1. Engel J., Jr Mesial temporal lobe epilepsy: what have we learned? Neuroscientist 2001;7(4):340–352 - PubMed
    1. Bruton CJ. The neuropathology of temporal lobe epilepsy. Oxford, England: Oxford University Press, 1988
    1. Margerison JH, Corsellis JA. Epilepsy and the temporal lobes. A clinical, electroencephalographic and neuropathological study of the brain in epilepsy, with particular reference to the temporal lobes. Brain 1966;89(3):499–530 - PubMed
    1. Thom M. Hippocampal sclerosis: progress since Sommer. Brain Pathol 2009;19(4):565–572 - PMC - PubMed
    1. Babb TL, Brown WJ, Pretorius J, Davenport C, Lieb JP, Crandall PH. Temporal lobe volumetric cell densities in temporal lobe epilepsy. Epilepsia 1984;25(6):729–740 - PubMed