. 2011 Aug;138(2):195-209.
doi: 10.1085/jgp.201110626. Epub 2011 Jul 11.

Spatial organization of RYRs and BK channels underlying the activation of STOCs by Ca(2+) sparks in airway myocytes

Affiliations

Spatial organization of RYRs and BK channels underlying the activation of STOCs by Ca(2+) sparks in airway myocytes

Lawrence M Lifshitz et al. J Gen Physiol. 2011 Aug.

Abstract

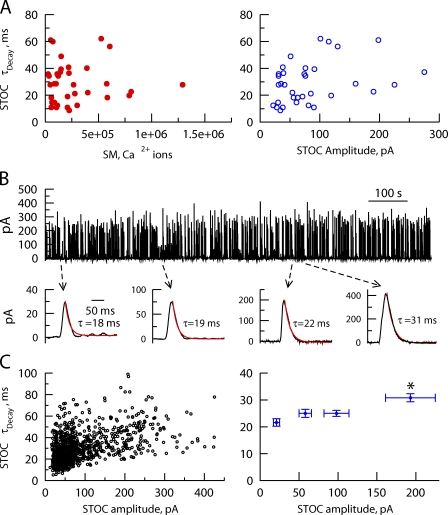
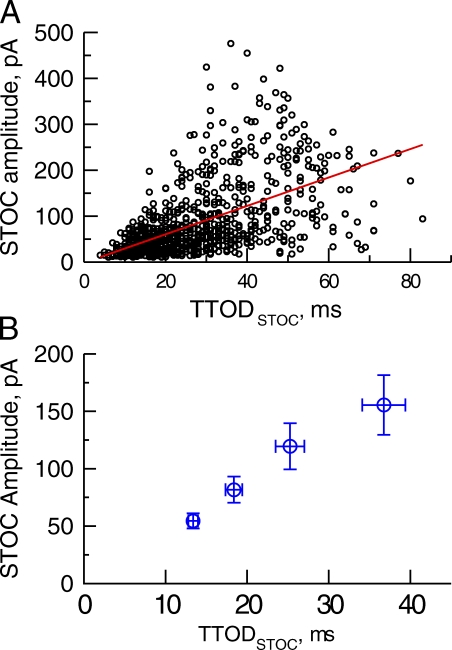
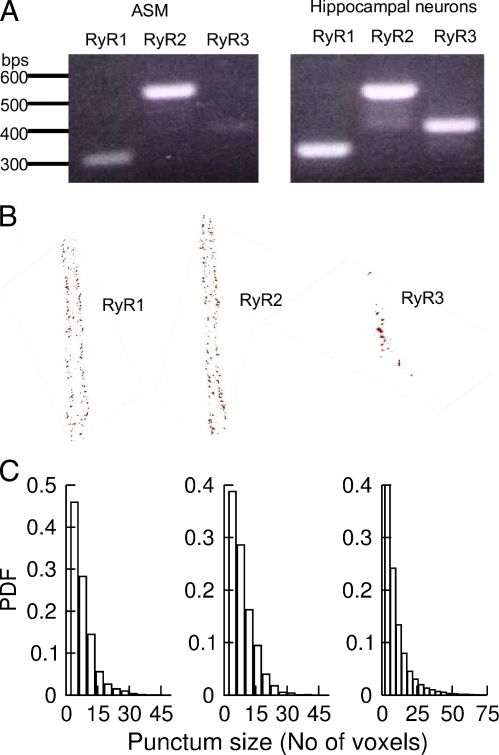
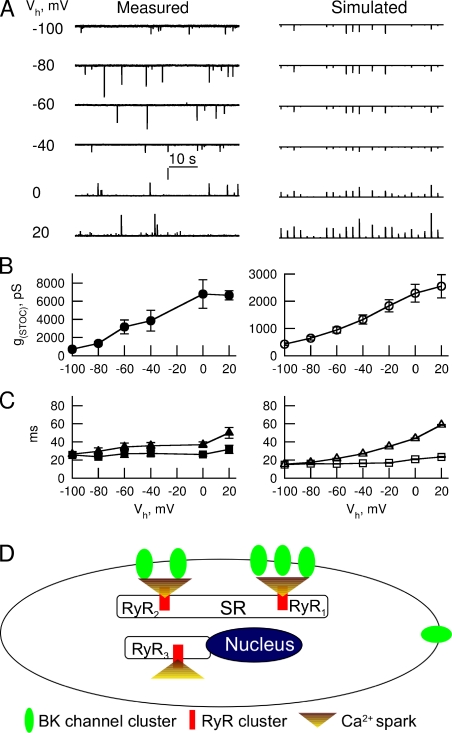
Short-lived, localized Ca(2+) events mediate Ca(2+) signaling with high efficiency and great fidelity largely as a result of the close proximity between Ca(2+)-permeable ion channels and their molecular targets. However, in most cases, direct evidence of the spatial relationship between these two types of molecules is lacking, and, thus, mechanistic understanding of local Ca(2+) signaling is incomplete. In this study, we use an integrated approach to tackling this issue on a prototypical local Ca(2+) signaling system composed of Ca(2+) sparks resulting from the opening of ryanodine receptors (RYRs) and spontaneous transient outward currents (STOCs) caused by the opening of Ca(2+)-activated K(+) (BK) channels in airway smooth muscle. Biophysical analyses of STOCs and Ca(2+) sparks acquired at 333 Hz demonstrate that these two events are associated closely in time, and approximately eight RYRs open to give rise to a Ca(2+) spark, which activates ∼15 BK channels to generate a STOC at 0 mV. Dual immunocytochemistry and 3-D deconvolution at high spatial resolution reveal that both RYRs and BK channels form clusters and RYR1 and RYR2 (but not RYR3) localize near the membrane. Using the spatial relationship between RYRs and BK channels, the spatial-temporal profile of [Ca(2+)] resulting from Ca(2+) sparks, and the kinetic model of BK channels, we estimate that an average Ca(2+) spark caused by the opening of a cluster of RYR1 or RYR2 acts on BK channels from two to three clusters that are randomly distributed within an ∼600-nm radius of RYRs. With this spatial organization of RYRs and BK channels, we are able to model BK channel currents with the same salient features as those observed in STOCs across a range of physiological membrane potentials. Thus, this study provides a mechanistic understanding of the activation of STOCs by Ca(2+) sparks using explicit knowledge of the spatial relationship between RYRs (the Ca(2+) source) and BK channels (the Ca(2+) target).


Figures

Figure 1.
Figure 1.
Relationship between Ca2+ sparks and their corresponding STOCs. The cells were voltage clamped at 0 mV, and the images were acquired at 333 Hz with an exposure time of 3 ms. Cytosolic Ca2+ was measured using 50 µM fluo-3, which was introduced into the cells in the K+ form through the patch pipette. (A) Temporal relationship between a STOC and a Ca2+ spark. Images (a) display the spatio-temporal evolution of the Ca2+ spark (Video 5). Changes in [Ca2+] in the images are expressed as ΔF/F0 (percentage) and displayed on a pseudocolor scale calibrated at the right. The traces shown are the time course of signal mass (b), its time derivative calibrated to give the underlying Ca2+ current flowing from the intracellular Ca2+ store into the cytosol, i.e., ICa(spark) (c), and the corresponding STOC (d). The numbers above the images correspond to the time when images were acquired as indicated in the time course of signal mass. Note that the endogenous Ca2+ buffer as estimated in Bao et al. (2008) was taken into account in this and in Fig. 2’s calculation of signal mass and ICa(spark). (B) Quantitative relationships between Ca2+ sparks and STOCs. Scatter plots show the correlations between (a) the rise time of Ca2+ spark signal mass (SM) and the time between the onset of the STOC and the onset of its decay, designated as time to the onset of decay (TTOD; r = 0.8869, P < 0.0001); (b) signal mass and STOC amplitude (r = 0.404, P = 0.005), (c) ICa(spark) and STOC amplitude (r = 0.4451, P = 0.002), and (d) signal mass rise time and STOC amplitude (r = 0.4816, P = 0.001). n = 35 in all panels.
Figure 2.
Figure 2.
STOC decay reflects the kinetics of BK channels. (A) No correlation between signal mass (SM) and STOC decay (left; r = 0.0091, P = 0.9588, n = 35) and between STOC amplitude and STOC decay (right; r = 0.3227, P = 0.0587, n = 35). The parameters were calculated from the data shown in Fig. 1. (B) A long recording of STOCs at 0 mV. Arrows depict the time when the events in the inserts occurred. Note that STOCs with different amplitudes can be fitted with a single exponential (solid red lines) with similar time constants. (C) Scatter plot of STOC amplitude and decay for the events from B (left). Mean data reveal that, except for the STOCs in the largest quartile, STOC decay is independent of its amplitude (right). *, P < 0.05 compared with other groups, t test after ANOVA; n = 8 cells.
Figure 3.
Figure 3.
STOC amplitude is correlated with TTODSTOC. STOCs are from the data shown in Fig. 2 C. (A) The relationship between TTODSTOC and STOC amplitude (r = 0.5720, P < 0.0001, n = 954 events). (B) Quartile analysis of TTODSTOC and STOC amplitude (n = 8 cells).
Figure 4.
Figure 4.
Type and distribution of RYRs in mouse ASM. (A) Reverse transcription PCR detected mRNA for three types of RYRs in ASM (left) and hippocampus (right). (B) RYR1 and RYR2 localize near the plasma membrane, whereas RYR3 localizes near the nucleus. The images show the localization of three types of RYRs in a 3-D projection of 1-µm thickness in the middle of the cells. The distribution of RYRs through the whole cells can be viewed in Videos 1–4. Pixel size in x and y is 80 nm, and the z spacing is 250 nm. (C) Histograms of RYR puncta. The mean size and SEM of puncta were 6.5 ± 0.5 voxels for RYR1 (n = 5 cells), 8.2 ± 0.7 voxels for RYR2 (n = 7 cells), and 13.0 ± 1.4 voxels (n = 5) for RYR3. P < 0.09, RYR1 versus RYR2; P < 0.002, RYR1 versus RYR3; P < 0.006, RYR2 versus RYR3; unpaired t test after ANOVA. PDF, probability density function.
Figure 5.
Figure 5.
Spatial relationship between RYRs and BK channels. (A) A representative immunostaining showing the spatial relationship between RYR2s and BK channels in approximately one third of the length of a cell. The anti-BK antibody was labeled with Alexa Fluor 488 and is pseudocolored green, and the anti-RYR antibody was labeled with Alexa Fluor 594 and is pseudocolored red. The images show the projection of BK channels and RYR2s localized within 720 nm from the surface membrane. The first inset is the expanded view of RYR2 and BK channels in the box region. Green lines connect RYR2 puncta to BK channels within 600 nm. The right inset depicts the relationship between an RYR2 punctum, as marked by the arrow in the first inset, and its nearby BK channel puncta, indicated by numbers. To display this RYR2 punctum and its corresponding BK channels, RYR2s and BK channels above and below were removed. The center to center distances between the RYR2 punctum and the BK channel puncta are 432 nm (1), 560 nm (2), and 598 nm (3). These distances were used to simulate IBKs shown in Fig. 7 and Fig. S3. (B) Histograms of the center of mass (COM) distance between RYR1 puncta and the closest BK channel puncta (left) and between RYR2 puncta and the closest BK channel puncta (right). Surprisingly, most BK channel puncta do not colocalize with either RYR1 puncta or RYR2 puncta. Dashed lines are the best fits of the probability distribution of distance to the closest random point. The fitting function is y = 2π × D × x × exp(−πDx2), where D is the puncta density (puncta/micrometers squared),and x is the distance (in micrometers; see eq. 8.2.9 in Cressie, 1993). From the fitting, it yields 1.11 puncta/µm2 for RYR1 and 1.02 puncta/µm2 for RYR2. This is not the density on the entire plasma membrane, but rather the density on the membrane near each RYR.
Figure 6.
Figure 6.
A Ca2+ spark activates multiple clusters of BK channels to generate a STOC. (A) Calculated Po of a BK channel at 0 mV (red line) and −40 mV (green line) as a function of distance from the spark. Combining eq. 14 from Bao and Cox (2005) for the Po,ss ([Ca2+],V) and reaction-diffusion simulations of sparks that yield free [Ca2+](d,t) allows the calculation of Po,ss(d) (setting t = 9 ms, the peak of ICa(spark)). (B and C) Probability distribution of the number of BK channel clusters activated by RYR2 (B) and RYR1 (C) puncta. The function in A was applied to the spatial relationship between RYRs and BK channels as shown in Fig. 5 to derive the number of BK channel puncta being activated. Black lines are the count of the number of puncta within 600 nm. Red lines and green lines are the expected numbers of BK clusters activated at 0 mV and −40 mV, respectively, by weighting each nearby BK cluster by its Po. The expected value is Σi(Po,i), where Po,i is the Po of the i-th BK cluster within 600 nm of the RYR. Error bars represent means ± SEM. PDF, probability density function.
Figure 7.
Figure 7.
Simulated STOCs recapitulate the salient feature of STOCs recorded experimentally. (A) The time course of IBKs (top) generated by each BK channel punctum as marked in Fig. 5 and the underlying [Ca2+] (bottom) as a result of a Ca2+ spark with an average ICa(spark) (see Materials and methods). The middle row shows the corresponding Po of BK channels in each punctum. Ek is −80 mV, and the holding potential is 0 mV. The three dotted lines mark the onset of IBK decay. The far right trace in the top row is the STOC created by adding the IBKs from the three puncta near this RYR2 punctum. (B) The parameters of simulated STOCs (open bars) activated by RYR2s resemble those from measured STOCs (closed bars). Simulated STOCs were obtained based on the spatial relationship between RYR2 and BK channels as shown in Fig. 5, and experimental STOCs were measured at 0 mV (Ek, −80 mV). Data are means ± SEM.
Figure 8.
Figure 8.
Voltage dependence of measured STOCs and simulated STOCs. To record and measure STOCs at large negative potentials, EK was set at −28 mV. (A, left) Traces exhibit STOCs recorded at different holding potentials (Vh). Vertical bar, 25 pA for the Vhs between –100 and –40 mV, and 50 pA for all others. (right) Simulated STOCs from 25 RYR2 puncta at the Vhs shown on the left. Note that the vertical bar in the left column also applies to all voltages on the right and represents 25 pA, but the horizontal time bar on the left does not apply to the results on the right (because the temporal spacing between simulated STOCs is arbitrary). (B) Averaged conductance of STOC (G(STOC)) as a function of voltage derived from measured (left) and simulated (right) STOCs (n = 6 cells for both cases in B and C). (C) TTODSTOC (closed and open squares for experimental and simulated data, respectively) and τdecay (closed and open triangles) as a function of voltage. (D) Spatial organization of RYRs and BK channels in ASM cells. RYR1 and RYR2 clusters localize near the plasma membrane and functionally couple with approximately two to three BK channel clusters to generate STOCs. RYR3 clusters distribute near the nucleus and could activate targets to be determined. BK channels in the plasma membrane outside the Ca2+ spark microdomains could be activated by unknown Ca2+-permeable channels. SR, sarcoplasmic reticulum. Error bars represent means ± SEM.

Similar articles

Cited by

References

    1. Amberg G.C., Bonev A.D., Rossow C.F., Nelson M.T., Santana L.F. 2003. Modulation of the molecular composition of large conductance, Ca(2+) activated K(+) channels in vascular smooth muscle during hypertension. J. Clin. Invest. 112:717–724 - PMC - PubMed
    1. Bao L., Cox D.H. 2005. Gating and ionic currents reveal how the BKCa channel’s Ca2+ sensitivity is enhanced by its β1 subunit. J. Gen. Physiol. 126:393–412 10.1085/jgp.200509346 - DOI - PMC - PubMed
    1. Bao R., Lifshitz L.M., Tuft R.A., Bellvé K., Fogarty K.E., ZhuGe R. 2008. A close association of RyRs with highly dense clusters of Ca2+-activated Cl− channels underlies the activation of STICs by Ca2+ sparks in mouse airway smooth muscle. J. Gen. Physiol. 132:145–160 10.1085/jgp.200709933 - DOI - PMC - PubMed
    1. Benham C.D., Bolton T.B. 1986. Spontaneous transient outward currents in single visceral and vascular smooth muscle cells of the rabbit. J. Physiol. 381:385–406 - PMC - PubMed
    1. Berridge M.J., Bootman M.D., Roderick H.L. 2003. Calcium signalling: dynamics, homeostasis and remodelling. Nat. Rev. Mol. Cell Biol. 4:517–529 10.1038/nrm1155 - DOI - PubMed

Publication types

MeSH terms