. 2011 Aug;138(2):165-78.
doi: 10.1085/jgp.201110605. Epub 2011 Jul 11.

Alignment of transmembrane regions in the cystic fibrosis transmembrane conductance regulator chloride channel pore

Affiliations

Alignment of transmembrane regions in the cystic fibrosis transmembrane conductance regulator chloride channel pore

Wuyang Wang et al. J Gen Physiol. 2011 Aug.

Abstract

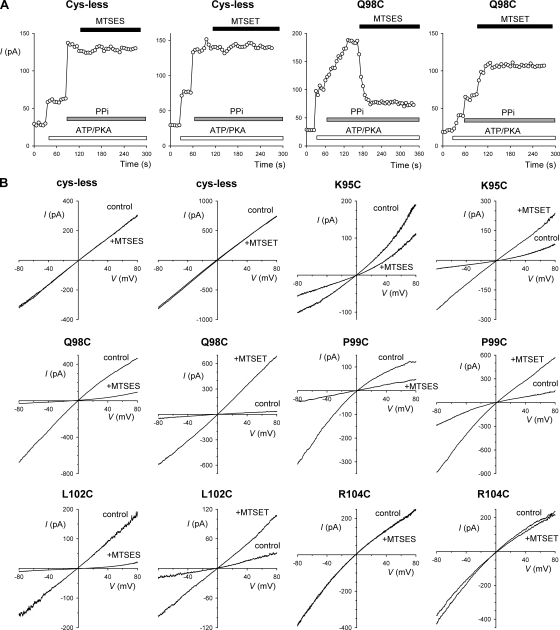
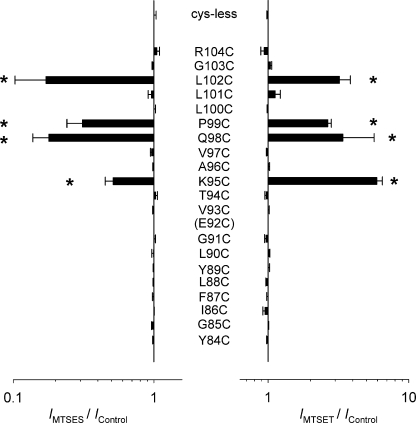
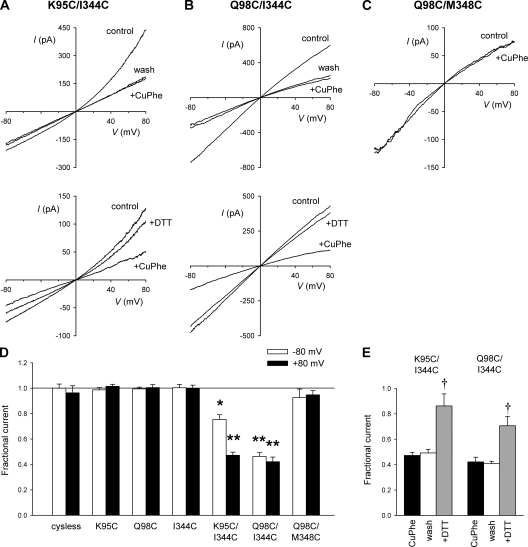
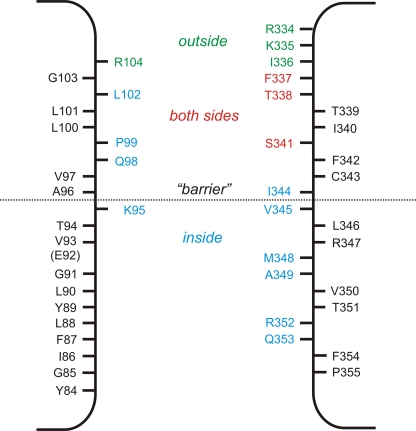
Different transmembrane (TM) α helices are known to line the pore of the cystic fibrosis TM conductance regulator (CFTR) Cl(-) channel. However, the relative alignment of these TMs in the three-dimensional structure of the pore is not known. We have used patch-clamp recording to investigate the accessibility of cytoplasmically applied cysteine-reactive reagents to cysteines introduced along the length of the pore-lining first TM (TM1) of a cysteine-less variant of CFTR. We find that methanethiosulfonate (MTS) reagents irreversibly modify cysteines substituted for TM1 residues K95, Q98, P99, and L102 when applied to the cytoplasmic side of open channels. Residues closer to the intracellular end of TM1 (Y84-T94) were not apparently modified by MTS reagents, suggesting that this part of TM1 does not line the pore. None of the internal MTS reagent-reactive cysteines was modified by extracellular [2-(trimethylammonium)ethyl] MTS. Only K95C, closest to the putative intracellular end of TM1, was apparently modified by intracellular [2-sulfonatoethyl] MTS before channel activation. Comparison of these results with recent work on CFTR-TM6 suggests a relative alignment of these two important TMs along the axis of the pore. This alignment was tested experimentally by formation of disulfide bridges between pairs of cysteines introduced into these two TMs. Currents carried by the double mutants K95C/I344C and Q98C/I344C, but not by the corresponding single-site mutants, were inhibited by the oxidizing agent copper(II)-o-phenanthroline. This inhibition was irreversible on washing but could be reversed by the reducing agent dithiothreitol, suggesting disulfide bond formation between the introduced cysteine side chains. These results allow us to develop a model of the relative positions, functional contributions, and alignment of two important TMs lining the CFTR pore. Such functional information is necessary to understand and interpret the three-dimensional structure of the pore.


Figures

Figure 1.
Figure 1.
Modification of cysteine-substituted CFTR-TM1 mutants by internal MTS reagents. (A) Example time courses of macroscopic currents (measured at +50 mV) carried by cys-less CFTR and Q98C inside-out membrane patches. After patch excision and recording of baseline currents, patches were treated sequentially with 20 nM PKA and 1 mM ATP, 2 mM PPi, and either 200 µM MTSES or 2 mM MTSET. Note that whereas these MTS reagents have no effect on cys-less CFTR current amplitude, they cause rapid inhibition (MTSES) or augmentation (MTSET) of current carried by Q98C. (B) Example leak-subtracted I-V relationships for cys-less CFTR, K95C, Q98C, P99C, L102C, and R104C, recorded from inside-out membrane patches after maximal channel activation with 20 nM PKA, 1 mM ATP, and 2 mM PPi. In each panel, currents recorded before the application of MTS reagents (control) and after full modification by 200 µM of intracellular MTSES or 2 mM MTSET had been achieved.
Figure 2.
Figure 2.
Effects of internal MTS reagents on cysteine-substituted CFTR-TM1 mutants. Mean effect of treatment with 200 µM MTSES (left) or 2 mM MTSET (right) on macroscopic current amplitude in cys-less CFTR and in each of 20 different cysteine-substituted TM1 mutants. Note that no currents were recorded from patches excised from cells transfected with E92C cDNA (see Results). Effects of these two MTS reagents were quantified by measuring current amplitudes at membrane potentials of +80 mV (for MTSES, left) and −80 mV (for MTSET, right) before MTS reagent application and after complete modification had taken place. Mean of data from three to nine patches. Asterisks indicate a significant difference from cys-less (P < 0.05).
Figure 3.
Figure 3.
Time course of modification by MTSES and MTSET. (A) Example time courses of macroscopic currents (measured at −50 mV during brief voltage excursions from a holding potential of 0 mV) carried by K95C (left) and L102C (right) as indicated, in inside-out membrane patches. Current amplitudes were measured every 6 s after the attainment of stable current amplitude after channel activation with 20 nM PKA, 1 mM ATP, and 2 mM PPi. In each case, MTSES (20 µM for K95C and 200 µM for L102C) was applied to the cytoplasmic face of the patch at time zero (as indicated by the hatched bar at the bottom of each panel). The decline in current amplitude after MTSES application has been fitted by a single-exponential function in each case. (B) Calculated modification rate constants for both MTSES (○) and MTSET (•) for each of the four MTS reagent–sensitive mutants listed. Asterisks indicate a significant difference from MTSES modification of K95C (P < 0.005), and daggers indicate a significant difference from MTSES modification of the same mutant (P < 0.05). Mean of data from three patches in each case is shown.
Figure 4.
Figure 4.
Modification of introduced cysteines by pretreatment with external MTSET. (A) Example leak-subtracted I-V relationships for each of the four MTSET-sensitive mutants named, showing the effects of the application of internal MTSET (2 mM) after maximal channel activation with 20 nM PKA, 1 mM ATP, and 2 mM PPi. Patches were excised from cells that had been pretreated with external MTSET (5 mM for 5 min) and showed similar sensitivity to internal MTSET as patches excised from untreated cells (see Fig. 1 B for examples). (B) Comparison of the effects of MTSET on macroscopic current amplitude at −80 mV between patches from untreated cells and patches from cells pretreated with external MTSET. There were no statistically significant differences for any mutant studied (P > 0.05). Mean of data from three to nine patches is shown.
Figure 5.
Figure 5.
Modification of introduced cysteines during pretreatment with internal MTSES. (A and B) Example leak-subtracted I-V relationships for each of the four MTSES-sensitive mutants named, showing the effects of the application of internal MTSES (200 µM) after maximal channel activation with 20 nM PKA, 1 mM ATP, and 2 mM PPi. Patches have been pretreated in two different ways (see Materials and methods): (A) pretreated with 200 µM MTSES, PKA, and ATP for 2 min; (B) pretreated with 200 µM MTSES alone for 2 min. Similar examples for patches that underwent no pretreatment are shown in Fig. 1 B. Note that for each mutant, after pretreatment with MTSES, PKA, and ATP, stimulated currents appeared refractory to the effects of internally applied MTSES (A), suggesting that channels had been covalently modified during the pretreatment. (C) Mean effect of internal MTSES on macroscopic current amplitude at +80 mV under three different sets of condition as indicated: no pretreatment (see Fig. 1 B); pretreated with MTSES, PKA, and ATP (A); and pretreated with MTSES alone (B). Asterisks indicate a significant difference from control (no pretreatment) conditions (P < 0.005); other groups not marked by an asterisk showed no significant difference from control conditions (P > 0.3). Mean of data from three to six patches is shown.
Figure 6.
Figure 6.
Cross-linking of TMs 1 and 6 by the oxidizing agent CuPhe. (A–C) Example leak-subtracted I-V relationships for K95C/I344C (A), Q98C/I344C (B), and Q98C/M348C (C) after channel activation with 20 nM PKA and 1 mM ATP. In A and B, current amplitude is decreased by the subsequent addition of CuPhe to the intracellular solution, whereas in C, CuPhe is without effect. In both CuPhe-sensitive channel constructs, the inhibitory effects of CuPhe were not reversed by washing CuPhe from the bath (top panels in both A and B), but were reversed by the addition of 5 mM DTT to the intracellular solution (bottom panels in both A and B). (D) Mean effect of internal CuPhe on macroscopic current amplitude under these conditions, measured at membrane potentials of −80 mV (white bars) and +80 mV (black bars). Note that cys-less CFTR, the single mutants K95C, Q98C, or I344C, and the double mutant Q98C/M348C were all insensitive to CuPhe under these conditions. Also note that CuPhe had a stronger inhibitory effect on currents carried by K95C/I344C when measured at +80 mV compared with −80 mV; this same apparent voltage dependence was previously reported for K95C/S1141C under similar experimental conditions (Zhou et al., 2010). In contrast, the inhibitory effects of CuPhe on Q98C/I344C were similar when measured at −80 mV or +80 mV. Asterisks indicate a significant difference from control: *, P < 0.005; **, P < 0.00005. (E) Mean effects of CuPhe (black bars), CuPhe followed by washing with normal bath solution (white bars), and CuPhe followed by DTT (gray bars) on macroscopic current amplitude in K95C/I344C (left) and Q98C/I344C (right) at +80 mV. Daggers indicate a significant difference from CuPhe alone (P < 0.005); washing alone (white bars) had no significant effect compared with CuPhe alone (P > 0.6). Mean of data from three to seven patches is shown in D and E.
Figure 7.
Figure 7.
Insensitivity to CuPhe before channel activation. (A and B) Example leak-subtracted I-V relationships for K95C/I344C (A) and Q98C/I344C (B) after channel activation with 20 nM PKA and 1 mM ATP in inside-out patches that had been pretreated with CuPhe for 2 min, and then washed to remove CuPhe. Currents were recorded before (control) and after (+DTT) the addition of 5 mM DTT to the cytoplasmic solution. (C) Mean effect of DTT on current amplitude in patches that had never seen CuPhe (no pretreatment), had been pretreated as in A and B (pretreatment CuPhe), or had been treated with CuPhe after channel activation (pretreatment CuPhe, PKA, ATP). In these experiments, an increase in current amplitude after DTT application is taken as evidence that disulfide bond formation had taken place. Asterisks indicate a significant difference from no pretreatment conditions (P < 0.05). Mean of data from three to six patches is shown in C.
Figure 8.
Figure 8.
Reversible inhibition by cytoplasmic Cu2+ ions. (A) Example leak-subtracted I-V relationships for cys-less (left), I344C (center), and Q98C/I344C (right) after channel activation with 20 nM PKA and 1 mM ATP. In each panel, currents are shown before (control) and after the addition of 10 µM Cu2+ to the intracellular solution. In all channel constructs studied, these inhibitory effects of Cu2+ were readily and rapidly reversed by washing Cu2+ from the bath (for example, see right panel for complete reversal of the strong blocking effect on Q98C/I344C). (B) Mean fractional current remaining after the addition of different concentrations of Cu2+ for cys-less (•), I344C (○), and Q98C/I344C (▾). Data are fitted as described in Materials and methods, giving Kd = 129 µM and nH = 1.36 for cys-less, Kd = 19.5 µM and nH = 1.21 for I344C, and Kd = 3.91 µM and nH = 1.65 for Q98C/I344C. (C) Mean Kd calculated from individual patches using fits of the kind shown in B. Asterisks indicate a significant difference from cys-less, and daggers indicate a significant difference between the double mutant indicated and either of the individual mutations alone (P < 0.05 in each case). Mean of data from four to seven patches shown in B and C.
Figure 9.
Figure 9.
Proposed locations of pore-lining side chains in TM1 and TM6. Location of residues that, when mutated to cysteine, are exposed to intracellular MTS reagents only (blue), to extracellular MTS reagents only (green), or to MTS reagents applied to either side of the membrane (red) (see also El Hiani and Linsdell, 2010). Other residues that we find not to be modified by intracellular MTS reagents and are presumed to be non–pore lining are shown in black. For TM1 (left), internal MTS modification is as shown in Fig. 2; external MTS modification is as defined in Fig. 4 or in previous work (Zhou et al., 2008). For TM6 (right), the model is as presented previously (El Hiani and Linsdell, 2010).

Similar articles

Cited by

References

    1. Akabas M.H., Kaufmann C., Cook T.A., Archdeacon P. 1994. Amino acid residues lining the chloride channel of the cystic fibrosis transmembrane conductance regulator. J. Biol. Chem. 269:14865–14868 - PubMed
    1. Alexander C., Ivetac A., Liu X., Norimatsu Y., Serrano J.R., Landstrom A., Sansom M., Dawson D.C. 2009. Cystic fibrosis transmembrane conductance regulator: using differential reactivity toward channel-permeant and channel-impermeant thiol-reactive probes to test a molecular model for the pore. Biochemistry. 48:10078–10088 10.1021/bi901314c - DOI - PMC - PubMed
    1. Anderson M.P., Gregory R.J., Thompson S., Souza D.W., Paul S., Mulligan R.C., Smith A.E., Welsh M.J. 1991. Demonstration that CFTR is a chloride channel by alteration of its anion selectivity. Science. 253:202–205 10.1126/science.1712984 - DOI - PubMed
    1. Bai Y., Li M., Hwang T.-C. 2010. Dual roles of the sixth transmembrane segment of the CFTR chloride channel in gating and permeation. J. Gen. Physiol. 136:293–309 10.1085/jgp.201010480 - DOI - PMC - PubMed
    1. Beck E.J., Yang Y., Yaemsiri S., Raghuram V. 2008. Conformational changes in a pore-lining helix coupled to cystic fibrosis transmembrane conductance regulator channel gating. J. Biol. Chem. 283:4957–4966 10.1074/jbc.M702235200 - DOI - PubMed

Publication types

MeSH terms