. 2011 Jul 11;194(1):89-103.
doi: 10.1083/jcb.201011118.

α-Synuclein and ALPS motifs are membrane curvature sensors whose contrasting chemistry mediates selective vesicle binding

Affiliations

α-Synuclein and ALPS motifs are membrane curvature sensors whose contrasting chemistry mediates selective vesicle binding

Iwona M Pranke et al. J Cell Biol. .

Abstract

Membrane curvature sensors have diverse structures and chemistries, suggesting that they might have the intrinsic capacity to discriminate between different types of vesicles in cells. In this paper, we compare the in vitro and in vivo membrane-binding properties of two curvature sensors that form very different amphipathic helices: the amphipathic lipid-packing sensor (ALPS) motif of a Golgi vesicle tether and the synaptic vesicle protein α-synuclein, a causative agent of Parkinson's disease. We demonstrate the mechanism by which α-synuclein senses membrane curvature. Unlike ALPS motifs, α-synuclein has a poorly developed hydrophobic face, and this feature explains its dual sensitivity to negatively charged lipids and to membrane curvature. When expressed in yeast cells, these two curvature sensors were targeted to different classes of vesicles, those of the early secretory pathway for ALPS motifs and to negatively charged endocytic/post-Golgi vesicles in the case of α-synuclein. Through structures with complementary chemistries, α-synuclein and ALPS motifs target distinct vesicles in cells by direct interaction with different lipid environments.


Figures

Figure 1.
Figure 1.
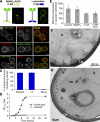
GMAPN and α-synuclein cause accumulations of distinct vesicular structures in yeast cells. (A, top) Schematic diagram of GMAPN-mCherry (mCh). (bottom) Localization of this construct in yeast cells. (B) Representative transmission EM images of cells expressing GMAPN-GFP. (C, top) Schematic diagram of α-synuclein–GFP. (bottom) Localization in yeast cells. (D) Representative EM image of cells expressing α-synuclein–GFP. (E) Immunogold labeling of cells expressing GMAPN-GFP using antibodies against GFP. Arrows show vesicular structures. N, nucleus; V, vacuole; ER, endoplasmic reticulum; CW, cell wall. (F) Strains IPY4 GMAPN-GFP and IPY5 α-synuclein (α-syn)–GFP were grown overnight under repressing conditions and then shifted (open symbols) or not shifted (closed symbols) to induction medium for the indicated times, and absorbance (Abs) of the cultures at OD600 was monitored. (G) Localization of GMAPN-mCherry and α-synuclein–GFP expressed together in wild-type yeast cells. (top and bottom) Two optical sections of a z stack obtained for a single cell. BY4742 cells carrying the indicated proteins on plasmids were grown overnight (A–E) or for 4 h (G) under inducing conditions and imaged.
Figure 2.
Figure 2.
GMAPN, but not α-synuclein, is a sensor of the curvature of neutral lipid membranes. (A and B) Structural features of the ALPS motif of GMAP-210 (aa 1–38) and of the α-synuclein AH and principles of the liposome-binding experiments. (A) The ALPS motif of GMAP-210 is assumed to form a perfect α helix. The structure of α-synuclein is from recent electron paramagnetic resonance experiments (Jao et al., 2008). (B) For clarity, only two 11-mer repeats (aa 9–30) are shown, but the remainder of the AH displays the same features. Yellow: Ala, Val, Leu, Ile, Met, Phe, and Trp. Pink: Ser, Thr, and Gly. Red: Asp and Glu. Blue: Lys and Arg. Green: other residues. To monitor lipid binding, the constructs were labeled with NBD on a cysteine at the beginning of the AH (mutations M1C in GMAPN and V3C in α-synuclein). The drawing is approximately to scale for a liposome of radius (R) = 30 nm. (C and D) Emission fluorescence spectra of [NBD]GMAPN (C) or [NBD]α-synuclein (D; 125 nM each) with or without calibrated neutral liposomes obtained by extrusion through polycarbonate filters of defined pore size or sonication (150 µM phospholipids; egg PC/POPE = 7:3; cholesterol/phospholipids = 1:5). (top insets) Fluorescence level at 530 nm as a function of liposome radius (as determined by dynamic light scattering). The horizontal lines indicate the fluorescence level in the absence of liposomes. (C, bottom inset) Fluorescence at 530 nm of 125 nM [NBD]GMAPN as a function of phospholipid concentration. Color coding for sonicated and extruded liposomes is indicated on the left. Calculation of partition coefficients is as previously described (see Materials and methods; Mesmin et al., 2007). N, N terminus; C, C terminus.
Figure 3.
Figure 3.
The ability of α-synuclein to sense the curvature of negatively charged lipid membranes depends on its poorly developed hydrophobic face. (A) Binding of wild-type α-synuclein to small liposomes containing increasing amounts of POPS (0–80 mol%) at the expense of POPC (80–0 mol%). The remaining phospholipid was egg PC (20 mol%) and the cholesterol/phospholipid ratio was 1:2. The liposomes were obtained by extrusion through 30-nm polycarbonate filters. The plot reports the fluorescence at 530 nm as determined from the spectra shown on the left as well as from an experiment performed with sonicated liposomes of the same composition. The extruded and sonicated liposomes displayed radii in the range of 46–53 and 23–48 nm, respectively. (B) Binding of wild-type α-synuclein to size-calibrated charged liposomes (egg PC/POPS = 4:6; cholesterol/phospholipids = 1:2). The three symbols used in the right plot correspond to three independent experiments. (inset) Fluorescence (fluo) of 125 nM [NBD]α-synuclein as a function of phospholipid concentration. Color coding for sonicated and extruded liposomes is indicated on the left. Calculation of partition coefficients is described in Materials and methods. (C) Sequence of the AH region of α-synuclein highlighting the repeating character of this region, which can be divided into 11-mer repeats. The mutations harbored by the T6 mutant consist in replacing all threonine residues (pink; left) of the nonpolar region by a more hydrophobic residue (Leu or Phe, yellow; right). Position of mutated residues in the 11-mer repeats is boxed (wild type; left) or shaded (mutant; right). Color coding is as in Fig. 2; in the alignment only mutated and charged residues are colored. (D) Binding of T6 mutant α-synuclein to small liposomes containing increasing amounts of POPS at the expense of POPC as in A. (E) Binding of T6 mutant α-synuclein to size-calibrated charged liposomes as in B. Concentrations in A, B, D, and E of proteins were 125 nM and phospholipids were 150 µM. Data in A and D were fitted (dashed lines) to a sigmoidal function (y = a + bxn/(c + xn)). The dashed lines in B and E were simply used to illustrate the apparent shape of the curve for binding as a function of liposome radius.
Figure 4.
Figure 4.
GMAPN and α-synuclein structures colocalize with distinct compartment markers in yeast. (A) Localization in SEY6210 cells of GMAPN-mCherry with either GFP-Emp47p or pro–α-factor–citrine and of Anp1p–monomeric RFP (mRFP) with GMAPN-GFP. (top) Representative images of colocalization of GMAPN-mCherry and GFP-Emp47p. (bottom) For quantifications, between 30 and 100 GMAPN structures were scored for the presence or absence of the cargo protein, and percentages were calculated (see Materials and methods). (B) Localization in SEY6210 cells of GMAPN-mCherry with the indicated GFP-tagged protein. Quantifications were performed as in A. (C) Localization in BY4742 of GMAPN-GFP or α-synuclein–GFP (α-syn) with FM4-64. (D–F) Localization in BY4742 of GMAPN-mCherry or α-synuclein–mCherry with GFP-tagged charge probes carrying the indicated number of lysine residues. Quantifications (D) and representative images (E and F) are shown. Cells were grown overnight at 23°C (A–C) or 16°C (D–F) under inducing conditions, and then, live cells were imaged and quantified. Means and SDs of at least three independent experiments are shown. Outlines of cells are indicated by dashed lines. Bars, 2 µm.
Figure 5.
Figure 5.
The ALPS motif of GMAP-210 acts as a localization determinant to cytoplasmic vesicular structures. (A) Localization of a truncated version of GMAPN-mCherry with the ALPS motif deleted (schematic diagram, left). Fluorescence (left) and overlay onto a differential interference contrast image (right) are shown. (B, left) Localization (bottom) of constructs is shown in the schematic diagrams (top). ALPS–Smc1-CC was constructed by replacing the CC region of GMAPN with that of the nuclear protein Smc1p (aa 158–374). (right) For quantifications, 60–130 structures for each GFP fusion protein were scored for localization to the nucleus, as visualized by Hoechst staining, or to the cytoplasm. Results shown are representative of two independent experiments. Outlines of cells are indicated by dashed lines. (C) Representative EM image of cells expressing the ALPS–Smc1-CC–GFP chimeric protein. Inset shows a higher magnification of the boxed region. BY4742 cells expressing the indicated proteins were grown overnight under inducing conditions before imaging.
Figure 6.
Figure 6.
The first 38 aa of α-synuclein act as a localization determinant to peripheral vesicular structures containing endosomal markers. (A) Schematic diagrams of the GMAPN-GFP and α-synuclein chimera–GFP probes and their localization in yeast cells. (B) Localization of α-synuclein chimera–GFP (α-syn chim) with FM4-64 (top) and Rtn1p-mRFP (bottom) and of α-synuclein chimera–mCherry with Lucifer yellow (LY; middle). (A and B) Bars, 2 µm. (C) Quantifications of the experiments shown in B. (D) Strain IPY6 α-synuclein chimera–GFP was grown overnight under repressing conditions and then shifted (open symbols) or not shifted (closed symbols) to induction medium for the indicated times, and absorbance (Abs) of the cultures at OD600 was monitored. (E) BY4742 cells expressing the indicated constructs were grown overnight under inducing conditions and treated with FM4-64, and the level of fluorescent signal in vacuolar structures was determined as described in Materials and methods. (F and G) Representative EM images of BY4742 cells expressing α-synuclein chimera–GFP induced for 16 h. Arrows show vesicular structures. N, nucleus; V, vacuole; CW, cell wall. Means and SDs of at least three independent experiments are shown.
Figure 7.
Figure 7.
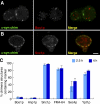
The α-synuclein chimeric probe colocalizes specifically with endocytic and post-Golgi markers. (A–C) Localization of the α-synuclein chimera–GFP (α-syn chim) with the indicated mCherry-tagged marker. Representative images for mCherry-Bos1p (A) and mCherry-Snc1p (B) are shown. Quantifications are depicted in C. Cells were grown overnight under repressing conditions and then transferred to induction medium for 2.5 (A–C) or 4 h (C). Means and SDs of at least three independent experiments are shown. Bar, 2 µm.
Figure 8.
Figure 8.
Inverting the ALPS motif sequence does not affect the capacity of GMAPN to accumulate early secretory pathway vesicles. (A) The GMAP-210 ALPS motif sequence and its inverted sequence (top) and their helical wheel representations (bottom). Yellow: Val, Leu, Ile, Met, Phe, and Trp. Pink: Ser and Thr. Red: Asp and Glu. Blue: Lys and Arg. Grey: other residues. (B) Representative EM image of cells expressing invALPS-GMAP. Inset shows boxed region at a higher magnification. N, nucleus; V, vacuole; CW, cell wall. (C) Localization of invALPS-GMAP–mCherry with GFP-Bet1p after 4 h of induction (top) and of invALPS-GMAP–GFP with FM4-64 after 2.5 h of induction (bottom). Bar, 2 µm. (D) Quantification of localization of invALPS-GMAP–mCherry with GFP-Bet1p, GFP-Sec22p, or GFP-Emp47p or of invALPS-GMAP–GFP with FM4-64 at the indicated times after induction. SEY6210 (or BY4742 for FM4-64 imaging) cells carrying the indicated proteins on plasmids were grown overnight under inducing conditions (B) or overnight under repressing conditions and shifted to induction medium for 2.5 or 4 h (C and D). Means and SDs of at least three independent experiments are shown. Outlines of cells are indicated by dashed lines. N, N terminus; C, C terminus.

Similar articles

Cited by

References

    1. Antonny B. 2011. Mechanisms of membrane curvature sensing. Annu. Rev. Biochem. 80:101–123 10.1146/annurev-biochem-052809-155121 - DOI - PubMed
    1. Auluck P.K., Caraveo G., Lindquist S. 2010. α-Synuclein: membrane interactions and toxicity in Parkinson’s disease. Annu. Rev. Cell Dev. Biol. 26:211–233 10.1146/annurev.cellbio.042308.113313 - DOI - PubMed
    1. Bankaitis V.A., Mousley C.J., Schaaf G. 2010. The Sec14 superfamily and mechanisms for crosstalk between lipid metabolism and lipid signaling. Trends Biochem. Sci. 35:150–160 10.1016/j.tibs.2009.10.008 - DOI - PMC - PubMed
    1. Bellí G., Garí E., Piedrafita L., Aldea M., Herrero E. 1998. An activator/repressor dual system allows tight tetracycline-regulated gene expression in budding yeast. Nucleic Acids Res. 26:942–947 10.1093/nar/26.4.942 - DOI - PMC - PubMed
    1. Ben Gedalya T., Loeb V., Israeli E., Altschuler Y., Selkoe D.J., Sharon R. 2009. Alpha-synuclein and polyunsaturated fatty acids promote clathrin-mediated endocytosis and synaptic vesicle recycling. Traffic. 10:218–234 10.1111/j.1600-0854.2008.00853.x - DOI - PMC - PubMed

Publication types

MeSH terms