. 2011 Sep;31(18):3710-22.
doi: 10.1128/MCB.05140-11. Epub 2011 Jul 11.

Stanniocalcin 2 is a negative modulator of store-operated calcium entry

Affiliations

Stanniocalcin 2 is a negative modulator of store-operated calcium entry

William Zeiger et al. Mol Cell Biol. 2011 Sep.

Abstract

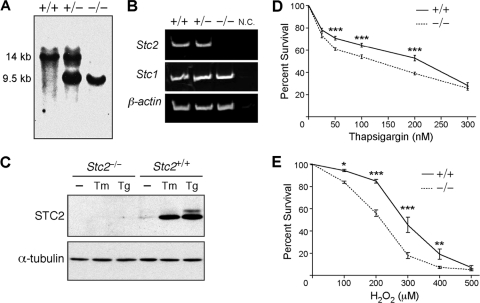
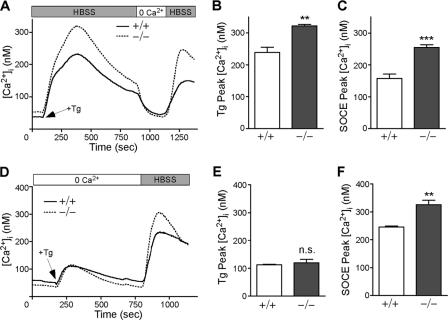
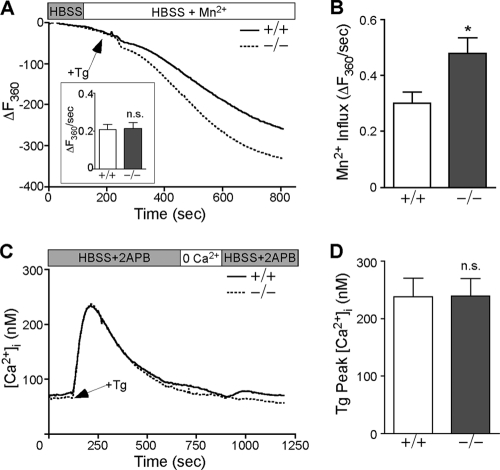
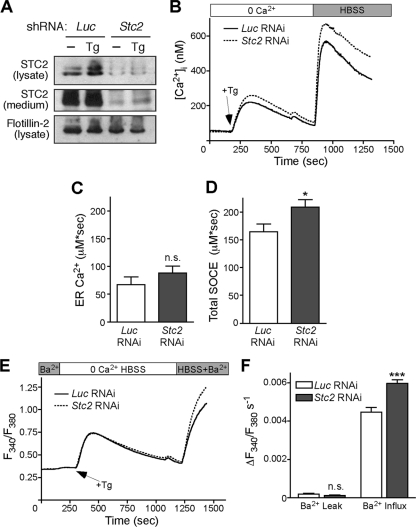
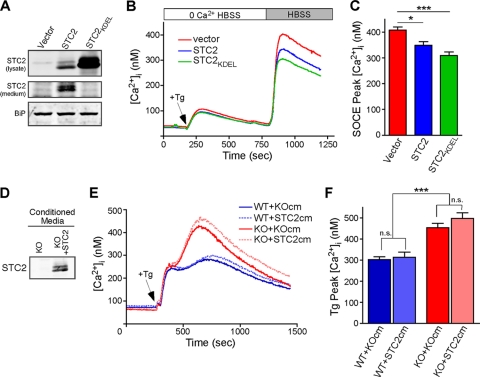
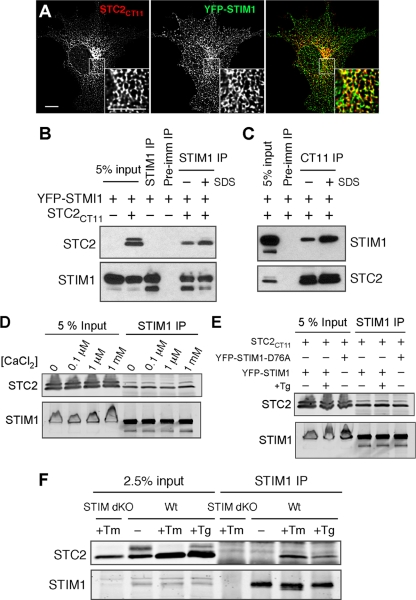
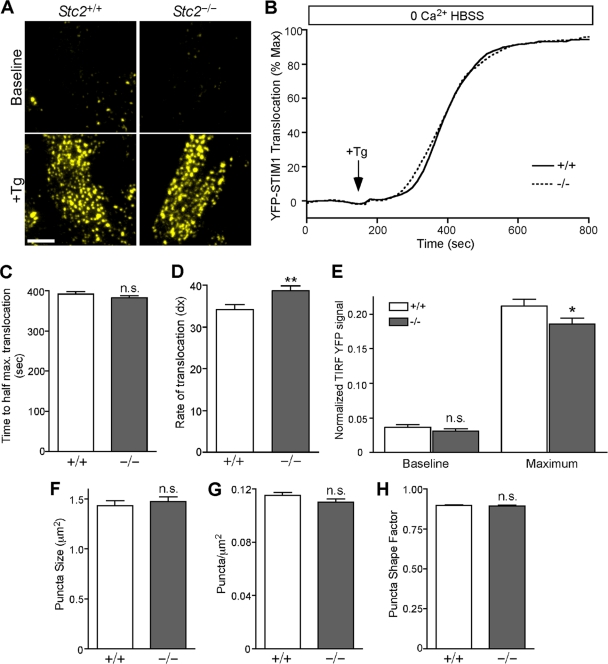
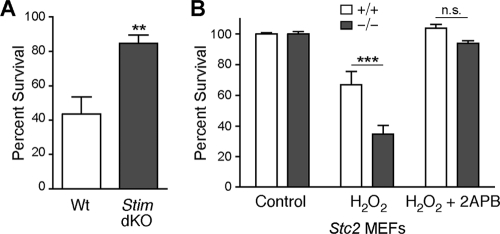
The regulation of cellular Ca(2+) homeostasis is essential for innumerable physiological and pathological processes. Stanniocalcin 1, a secreted glycoprotein hormone originally described in fish, is a well-established endocrine regulator of gill Ca(2+) uptake during hypercalcemia. While there are two mammalian Stanniocalcin homologs (STC1 and STC2), their precise molecular functions remain unknown. Notably, STC2 is a prosurvival component of the unfolded protein response. Here, we demonstrate a cell-intrinsic role for STC2 in the regulation of store-operated Ca(2+) entry (SOCE). Fibroblasts cultured from Stc2 knockout mice accumulate higher levels of cytosolic Ca(2+) following endoplasmic reticulum (ER) Ca(2+) store depletion, specifically due to an increase in extracellular Ca(2+) influx through store-operated Ca(2+) channels (SOC). The knockdown of STC2 expression in a hippocampal cell line also potentiates SOCE, and the overexpression of STC2 attenuates SOCE. Moreover, STC2 interacts with the ER Ca(2+) sensor STIM1, which activates SOCs following ER store depletion. These results define a novel molecular function for STC2 as a negative modulator of SOCE and provide the first direct evidence for the regulation of Ca(2+) homeostasis by mammalian STC2. Furthermore, our findings implicate the modulation of SOCE through STC2 expression as one of the prosurvival measures of the unfolded protein response.


Figures

Fig. 1.
Fig. 1.
Characterization of Stc2−/− MEFs. (A) Southern blot of mouse tail DNA isolated from Stc2+/+, Stc2+/−, and Stc2−/− animals. (B) RT-PCR analysis of Stc2 expression in Stc2+/+, Stc2+/−, and Stc2−/− kidneys. N.C., negative control RT-PCR without reverse transcriptase. (C) Western blot analysis of STC2 expression in MEFs treated with Tm (2 μg/ml) or Tg (300 nM) for 16 h. WT and Stc2−/− MEFs were treated for 8 h with a range of concentrations of Tg (D) or H2O2 (E) to elicit ER or oxidative stress. Cell viability was determined using colorimetric WST-8 assays, and percent survival was calculated relative to that of untreated cells. Each point on the graph represents the means ± standard errors of the means (SEM) from at least three independent experiments. *, P < 0.05; **, P < 0.01; ***, P < 0.001 (each by one-way analysis of variance [ANOVA]).
Fig. 2.
Fig. 2.
Stc2−/− MEFs display altered Ca2+ homeostasis. (A) WT and Stc2−/− MEFs loaded with 5 μM Fura-2 AM were treated with Tg (300 nM) in the presence of extracellular Ca2+ (1.3 mM Ca2+ HBSS), followed by perfusion with 0 Ca2+ HBSS and the add back of extracellular Ca2+ to trigger SOCE. Traces represent the averages from six to seven experiments each for WT and Stc2−/− MEFs. Average peak Ca2+ levels (means ± SEM) after the addition of Tg (B) or extracellular Ca2+ (C) for SOCE are shown. (D) WT and Stc2−/− MEFs were treated with Tg in the absence of extracellular Ca2+ before Ca2+ add back. Each trace represents averages from five experiments. Graphs represent average peak Ca2+ levels (mean ± SEM) after the addition of Tg (E) or extracellular Ca2+ (F) for SOCE. **, P < 0.01; ***, P < 0.001 (each by Student's t test).
Fig. 3.
Fig. 3.
Store-operated Ca2+ entry is increased in Stc2−/− MEFs. (A) Fura-2-loaded WT and Stc2−/− MEFs were perfused with HBSS containing 2 mM MnCl2, followed by treatment with Tg (300 nM). Images were acquired at an excitation of 360 nm (the isosbestic point for Fura-2). Traces represent averages from at least 15 experiments. The inset shows average Mn2+ leak rates before the addition of Tg. (B) Average Mn2+ influx rate (corrected for Mn2+ leak) after Tg addition (means ± SEM). (C) WT and Stc2−/− MEFs loaded with Fura-2 were perfused with HBSS containing 50 μM 2-APB, a specific inhibitor of SOCE, followed by treatment with Tg, perfusion in 0 Ca2+ HBSS, and Ca2+ add back in the presence of 2-APB. Traces represent averages from nine experiments. (D) Quantification of average [Ca2+]i peaks after Tg addition (means ± SEM) in the presence of HBSS and 2-APB. *, P < 0.05 by Student's t test.
Fig. 4.
Fig. 4.
Knockdown of Stc2 expression in H19-7 cells increases SOCE. (A) Analysis of STC2 expression in stable luciferase (Luc) and STC2 RNAi pools at steady state and following treatment with Tg (300 nM) to induce ER stress. Aliquots of cell lysates and immunoprecipitates of conditioned medium were analyzed by immunoblotting. (B) Differentiated H19-7 pools of cells stably expressing STC2 or Luc shRNA were loaded with 5 μM Fura-2 AM. Cells then were perfused with 0 Ca2+ HBSS followed by treatment with Tg in 0 Ca2+ HBSS. After store depletion, HBSS was added to trigger SOCE. Each trace represents the averages from 12 experiments. Graphs represent total [Ca2+]i increases (area under the curve) after Tg addition (C) or Ca2+ add back (D). *, P < 0.05 by Student's t test; n.s., not significant. (E) Differentiated H19-7 cells stably expressing STC2 or Luc shRNA were loaded with 5 μM Fura-2 AM. Cells then were perfused with 0 Ca2+ HBSS plus 2 mM BaCl2 followed by treatment with Tg (1 μM) in 0 Ca2+ HBSS. Following store depletion, 0 Ca2+ HBSS plus 2 mM BaCl2 was added back to trigger SOCE. Each trace represents the averages from six experiments. (F) Ba2+ influx rates were calculated by subtracting the linear portion of the slope before Tg addition (Ba2+ leak) from the slope after Tg addition. **, P < 0.01; ***, P < 0.001 (each by one-way ANOVA).
Fig. 5.
Fig. 5.
Overexpression of STC2 reduces SOCE. (A) Western blot analysis of STC2 or STC2KDEL expression in the lysates and conditioned medium of pooled stably transduced MEFs. (B) Control and STC2-overexpressing MEFs loaded with Fura-2 were perfused in 0 Ca2+ HBSS before the addition of Tg (300 nM) and Ca2+ add back. Traces represent averages from eight experiments. (C) Quantification of [Ca2+]i peaks after Ca2+ add back (means ± SEM). (D) Western blot analysis of conditioned medium samples from Stc2−/− MEFs (KO medium) or Stc2−/− MEFs overexpressing STC2 (KO+STC2 medium). (E) Fura-2-loaded WT or Stc2−/− MEFs were incubated in KO or KO+STC2 medium for ∼10 min before Tg was added directly to the media, and [Ca2+]i was monitored over time. Traces represent averages from at least 10 experiments. (F) Quantification of [Ca2+]i peaks after the addition of Tg (means ± SEM). *, P < 0.05; **, P < 0.01; ***, P < 0.001 (each by one-way ANOVA).
Fig. 6.
Fig. 6.
STC2 interacts with STIM1. (A) Immunofluorescence labeling of COS cells coexpressing STC2CT11 and YFP-STIM1. The maximum-intensity projection of two planes of the deconvolved Z stack is depicted. The inset shows an enlarged area indicated by a box. Scale bar, 10 μm. (B and C) COS cells were transfected as indicated and analyzed by coimmunoprecipitation using STIM1, CT11, or preimmune serum. (D) Coimmunoprecipitation of COS cells cotransfected with STC2CT11 and YFP-STIM1 with anti-STIM1 in the presence of EDTA or 0.1 μM, 1 μM, or 1 mM CaCl2. (E) Coimmunoprecipitation of COS cells cotransfected with STC2CT11 and YFP-STIM1 or YFP-STIM1D76A before or after a 10-min treatment with Tg (1 μM) in 0 Ca2+ HBSS to deplete ER Ca2+ stores. (F) Coimmunoprecipitation analysis of WT or Stim1−/− Stim2−/− (Stim dKO) MEFs stably expressing STC2CT11 under basal conditions or after overnight treatment with Tm or Tg to induce ER stress.
Fig. 7.
Fig. 7.
STIM1 translocation is not potentiated in Stc2−/− MEFs following store depletion. (A) WT and Stc2−/− MEFs stably expressing YFP-STIM1 were imaged by TIRF microscopy. Representative TIRF images are shown before and after ER Ca2+ store depletion by the addition of Tg. Scale bar, 10 μm. (B) Time-lapse TIRF images of transfected WT and Stc2−/− MEFs treated with Tg (300 nM) in 0 Ca2+ HBSS were acquired to measure the translocation of YFP-STIM1 to puncta near the plasma membrane. Total YFP TIRF intensity was quantified, and STIM1 translocation was plotted over time and normalized to the maximum YFP-STIM1 TIRF signal. Traces represent the averages from 12 experiments, with ∼6 to 12 cells/experiment. (C and D) Data from individual cells were fit using a Boltzmann sigmoidal function, and the time to half-maximal translocation (C) and the rate constant (dX) (where dX is equal to the change in time corresponding to the greatest change in STIM1 translocation, such that larger dX values correspond to lower rates of translocation) (D) were calculated and compared between WT and Stc2−/− MEFs. (E) Total translocated STIM1 values at baseline and at maximum were quantified by the normalization of TIRF YFP signals to wide-field fluorescence. n.s., not significant. *, P < 0.05; **, P < 0.01 (each by Student's t test). (F to H) Quantification of YFP-STIM1 puncta size (F), density (G), and shape factor (H), where 1 is equal to a perfect circle, in WT and Stc2−/− MEFs following store depletion.
Fig. 8.
Fig. 8.
Susceptibility of Stc2−/− MEFs to oxidative stress is rescued by inhibition of SOCE. (A) WT and Stim1−/− Stim2−/− (Stim dKO) MEFs were treated with H2O2 (200 μM) for 16 h, and cell survival was quantified relative to that of untreated controls using a colorimetric WST-8 assay. **, P < 0.01 by Student's t test. (B) Cell survival of WT and Stc2−/− MEFs was quantified following treatment with H2O2 (200 μM) for 16 h in the presence or absence of 100 μM 2-APB. Data represent the means ± SEM from three experiments, each performed in triplicate. ***, P < 0.001 by one-way ANOVA; n.s., not significant.

References

    1. Berridge M. J., Bootman M. D., Roderick H. L. 2003. Calcium signalling: dynamics, homeostasis and remodelling. Nat. Rev. Mol. Cell Biol. 4:517–529 - PubMed
    1. Bertolotti A., Zhang Y., Hendershot L. M., Harding H. P., Ron D. 2000. Dynamic interaction of BiP and ER stress transducers in the unfolded-protein response. Nat. Cell Biol. 2:326–332 - PubMed
    1. Bolte S., Cordelieres F. P. 2006. A guided tour into subcellular colocalization analysis in light microscopy. J. Microsc. 224:213–232 - PubMed
    1. Bouras T., et al. 2002. Stanniocalcin 2 is an estrogen-responsive gene coexpressed with the estrogen receptor in human breast cancer. Cancer Res. 62:1289–1295 - PubMed
    1. Buckanovich R. J., et al. 2007. Tumor vascular proteins as biomarkers in ovarian cancer. J. Clin. Oncol. 25:852–861 - PubMed

Publication types

MeSH terms