. 2011 Sep;31(17):3653-69.
doi: 10.1128/MCB.05020-11. Epub 2011 Jul 11.

1,25-dihydroxyvitamin D(3) ameliorates Th17 autoimmunity via transcriptional modulation of interleukin-17A

Affiliations

1,25-dihydroxyvitamin D(3) ameliorates Th17 autoimmunity via transcriptional modulation of interleukin-17A

Sneha Joshi et al. Mol Cell Biol. 2011 Sep.

Abstract

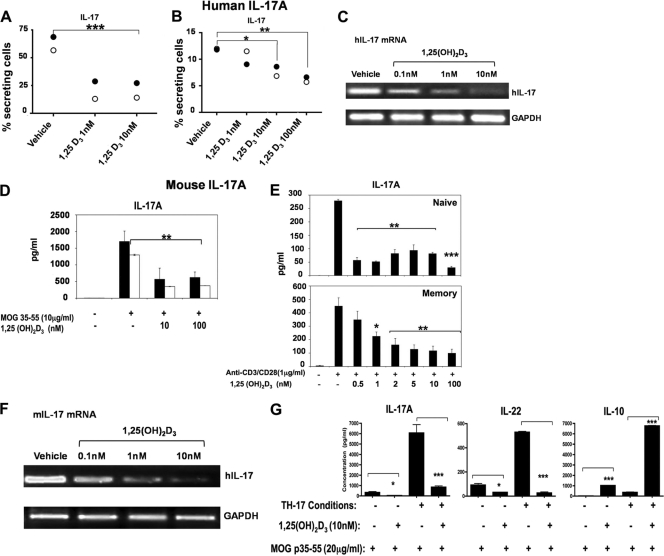
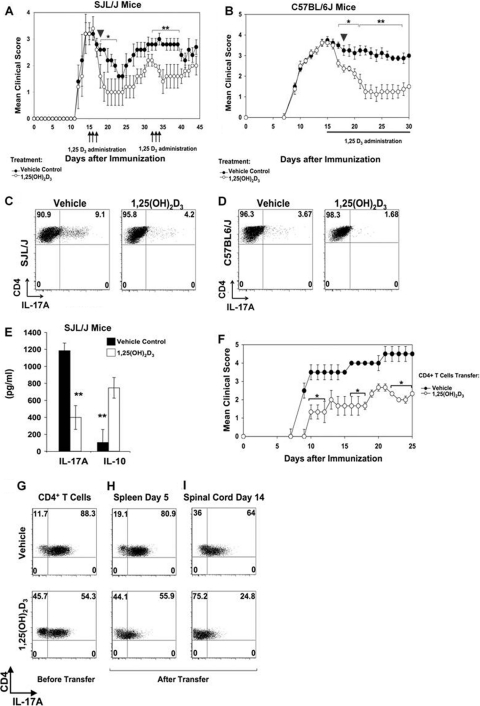
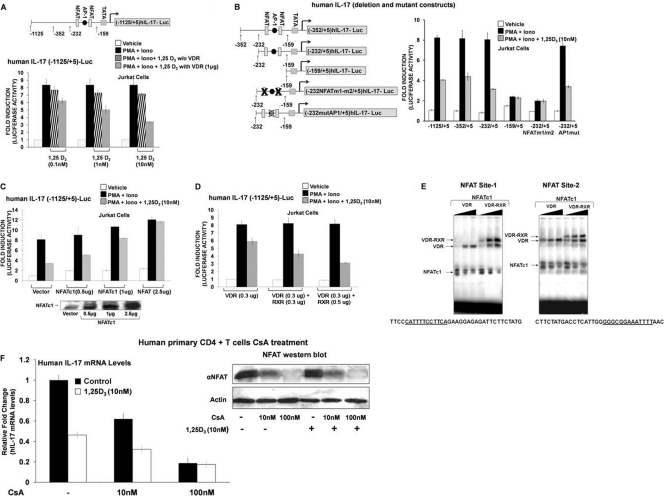
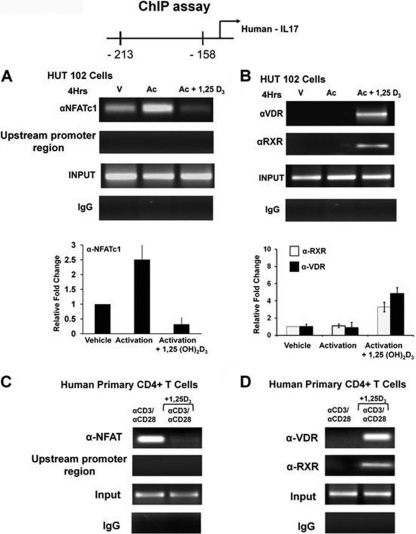
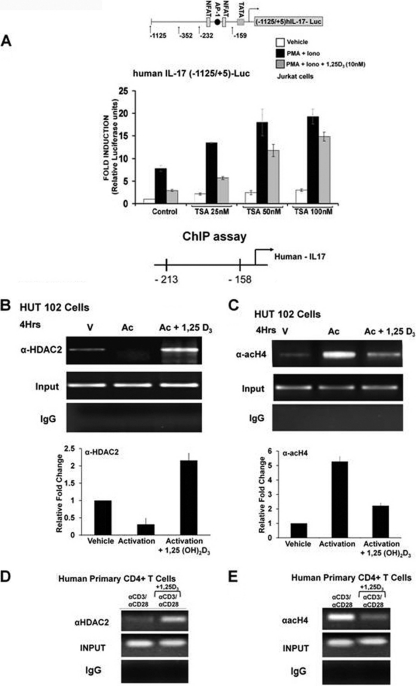
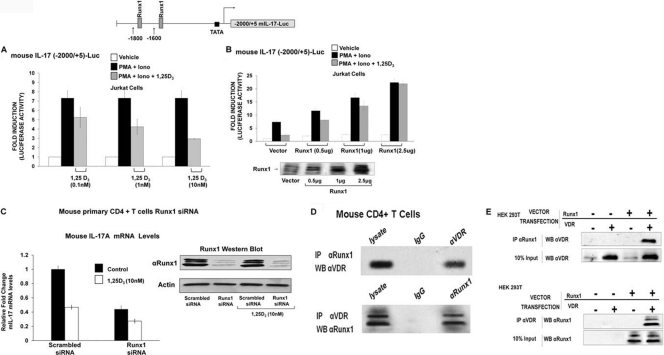
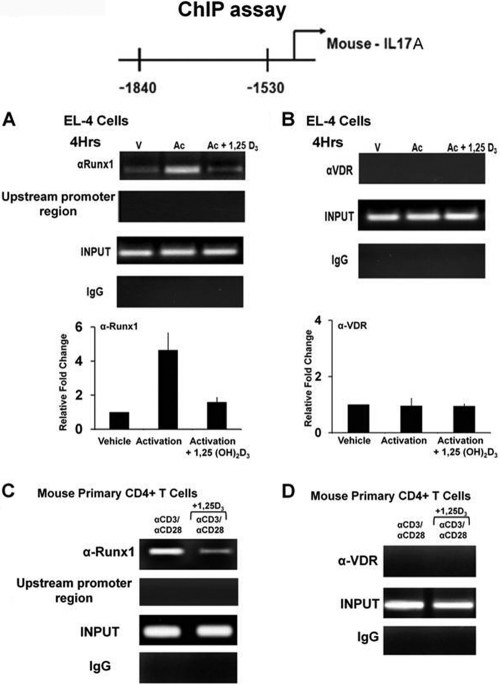
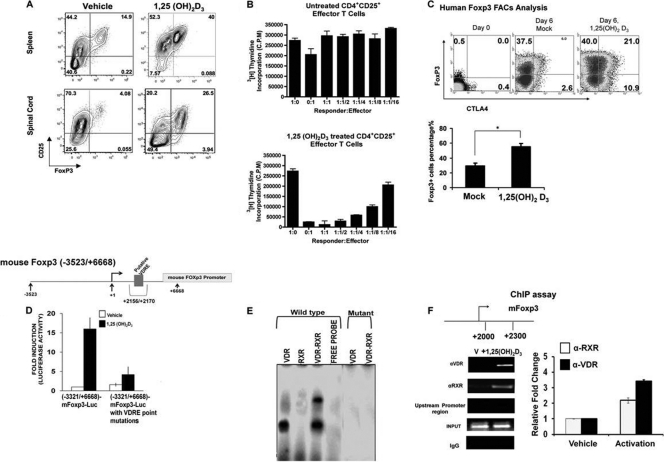
A new class of inflammatory CD4(+) T cells that produce interleukin-17 (IL-17) (termed Th17) has been identified, which plays a critical role in numerous inflammatory conditions and autoimmune diseases. The active form of vitamin D, 1,25-dihydroxyvitamin D(3) [1,25(OH)(2)D(3)], has a direct repressive effect on the expression of IL-17A in both human and mouse T cells. In vivo treatment of mice with ongoing experimental autoimmune encephalomyelitis (EAE; a mouse model of multiple sclerosis) diminishes paralysis and progression of the disease and reduces IL-17A-secreting CD4(+) T cells in the periphery and central nervous system (CNS). The mechanism of 1,25(OH)(2)D(3) repression of IL-17A expression was found to be transcriptional repression, mediated by the vitamin D receptor (VDR). Transcription assays, gel shifting, and chromatin immunoprecipitation (ChIP) assays indicate that the negative effect of 1,25(OH)(2)D(3) on IL-17A involves blocking of nuclear factor for activated T cells (NFAT), recruitment of histone deacetylase (HDAC), sequestration of Runt-related transcription factor 1 (Runx1) by 1,25(OH)(2)D(3)/VDR, and a direct effect of 1,25(OH)(2)D(3) on induction of Foxp3. Our results describe novel mechanisms and new concepts with regard to vitamin D and the immune system and suggest therapeutic targets for the control of autoimmune diseases.


Figures

Fig. 1.
Fig. 1.
Regulation of IL-17A expression and mRNA by 1,25(OH)2D3. (A to C) 1,25(OH)2D3 reduces the percentage of human IL-17A-secreting CD4+ T cells and hIL-17A mRNA levels. (A and B) Resting CD4+ T cells were isolated from PBMCs of healthy donors 1 (closed circles) and 2 (open circles), activated with anti-CD3 and anti-CD28 under Th17 conditions in the presence of 1, 10, or 100 nM 1,25(OH)2D3 or vehicle. In panel A, cells were passed through 3 cycles of activation and expansion and then stained to detect intracellular hIL-17A. In panel B, cells were activated for 72 h and then stained to detect intracellular hIL-17A. Data are presented as percentages of IL-17+ T cells. **, P < 0.01; ***, P < 0.001. (C) RT-PCR analysis of hIL-17A mRNA. Inhibition of hIL-17A mRNA by 1,25(OH)2D3 was observed using human primary CD4+ T cells polarized under Th17 conditions for 5 days in the presence or absence of 1,25(OH)2D3 (0.1 to 10 nM). Similar results were observed in two additional experiments. (D to G) 1,25(OH)2D3 treatment inhibits Th17 differentiation, mIL-17A mRNA, and mIL-17A secretion in mouse cells. (D) Lymph node cells (black bars) or splenocytes (white bars) isolated from T cell receptor transgenic mice (2D2) were activated with MOG p35-55 (10 μg/ml) in the presence or absence of 1,25(OH)2D3 (10 and 100 nM). A total of 48 h later, supernatants were used to measure IL-17A by ELISA. IL-17A was significantly reduced by 1,25(OH)2D3. **, P < 0.01 compared to MOG activation in the absence of 1,25(OH)2D3. (E) Naïve or memory CD4+ T cells were isolated from spleens of naïve 2D2 mice. Cells were activated and treated with 1,25(OH)2D3 (0.5 to 100 nM) 48 h later for memory cultures and 96 h later for naïve cultures. Supernatants were subjected to IL-17A ELISA. (F) RT-PCR analysis of mIL-17A mRNA. Inhibition of mIL-17A mRNA by 1,25(OH)2D3 was observed using mouse primary CD4+ T cells polarized under Th17 conditions for 3 days in the presence or absence of different concentrations of 1,25(OH)2D3. Similar results were observed in two additional experiments. (G) 1,25(OH)2D3 regulates Th17 cytokines during T cell activation under Th0 or Th17 differentiation conditions. Naïve 2D2 splenocytes were cultured with MOG p35-55 (20 μg/ml) under Th17 conditions or Th0 conditions. Cells were treated with either vehicle or 1,25(OH)2D3 (10 nM) for 72 h. The cytokines indicated in the figure were measured from supernatants using ELISA. Data are presented as the means of triplicate determinations ± SE. *, P < 0.05; ***, P < 0.001 (tested in two-way ANOVA).
Fig. 2.
Fig. 2.
1,25(OH)2D3 treatment reverses ongoing EAE and ameliorates Th17-induced EAE in recipient mice. (A) PLPp139-151-EAE was induced in SJL/J mice and scored daily. At day 14 (peak of disease), mice were randomize into two groups (n = 12 per group). Mice were injected with either vehicle or 1,25(OH)2D3 for 3 consecutive days (arrows), days 15 to 18, and days 31 to 34. Mice showed reduced clinical scores after the transient treatments. *, P < 0.05; **, P < 0.01 (compared to vehicle-treated group). (B) MOG p35-55 EAE was induced in C57BL/6 mice and scored daily. At day 15 (peak of disease), mice were randomized into two groups (n = 15 per group). Treatment with either vehicle or 1,25(OH)2D3 was administered daily, starting on day 15 (days 15 to 30). Treated mice showed reduced clinical scores in the chronic phase. *, P < 0.05; **, P < 0.01 (compared to vehicle-treated group). (C and D) On day 18, as shown in panels A and B, 3 mice from each group were killed (arrowhead), and mononuclear cells were isolated from spinal cords for IL-17A analysis. (C) Lymphocytes isolated from a representative SJL/J mice (arrowhead in panel A). (D) Lymphocytes isolated from a representative C57BL/6 mice (arrowhead in panel B). Data are shown as representative FACS plots of 1 mouse out of 3. In each plot, CD45+ CD4+ IL-17A mononuclear infiltrated T cells are gated. (E) Mononuclear infiltrates isolated from brains of SJL/J mice killed as shown in panel C were activated with PLPp139-151 (50 ng/ml) for 72 h, and ELISAs were performed. Results shown are the means of triplicate determinations ± SE. **, P < 0.01 (1,25(OH)2D3 treatment versus that of vehicle). (F) Naïve CD4+ T cells were isolated from 2D2 splenocytes and were differentiated into Th17 cells in the presence of either vehicle or 1,25(OH)2D3 (10 nM). After 3 expansion cycles, differentiated into Th17 cells in the presence of either vehicle or 1,25(OH)2D3 (10 nM). After 3 expansion cycles, adoptive transfer into naïve recipient C57BL/6 mice was performed. A total of 20 ×106 Th17 cells treated by either 1,25(OH)2D3 or vehicle were injected i.v. on day 0 (n = 10 per group). Recipient C57BL/6 mice were scored daily. (G) Assessment of IL-17A-secreting cells after 1,25(OH)2D3 treatment (bottom) versus vehicle treatment (top) before adoptive transfer. (H) Assessment of IL-17A-secreting cells after 1,25(OH)2D3 treatment (bottom) versus vehicle treatment (top) in the spleen 5 days post-adoptive transfer. (I) Assessment of IL-17A-secreting cells after 1,25(OH)2D3 treatment (bottom) versus vehicle treatment (top) in the CNS. Assessment was performed by FACS analysis, and data are presented as dot plots of IL-17A versus CD4+ T cells. Each FACS plot is of a representative mouse.
Fig. 3.
Fig. 3.
Regulation of hIL-17A transcription by 1,25(OH)2D3. NFATc1 relieves 1,25(OH)2D3-mediated repression of hIL-17A transcription, RXR with VDR contributes to transcriptional repression, and VDR/RXR bind to the NFAT sites. (A) Jurkat cells were cotransfected with the hIL-17A (−1125/+5) promoter and either vector alone (black bars and striped bars) or pAV-hVDR expression vector (1 μg) (gray bars). Cells were stimulated for 9 h with PMA and ionomycin (Iono) in the presence or absence of the indicated concentration of 1,25(OH)2D3. 1,25(OH)2D3 treatment (1 and 10 nM) resulted in a significant repression of hIL-17A transcriptional activation in the presence of transfected VDR (P < 0.01). In all subsequent transcription assays, 1 μg/well VDR expression plasmid was transfected (unless otherwise indicated). (B, left) Schematic of hIL-17A promoter deletion constructs or deletion constructs with specific mutations in the NFAT sites or the AP1 site (38). (Right) The human T cell line Jurkat was transfected with the hIL-17A promoter −1125/+5, deletion constructs −353/+5, −232/+5, and −159/+5, or deletion constructs with specific mutations in the NFAT sites (−232NFATm1/m2/+5) or the AP1 site (−232AP1mut/+5). Cells (24 h posttransfection) were stimulated for 9 h with PMA and ionomycin in the presence or absence of 10 nM 1,25(OH)2D3. (C) Overexpression of NFATc1 relieves 1,25(OH)2D3-mediated repression of hIL-17A transcription. Jurkat cells were cotransfected with hIL-17A promoter (−1125/+5) and pSRα-NFATc1 expression plasmid at the indicated concentrations. At 24 h posttransfection, cells were activated with PMA and ionomycin in the absence or presence of 1,25(OH)2D3 (10 nM) for 9 h. P < 0.05 [activation plus 1,25(OH)2D3, vector transfection versus activation plus 1,25(OH)2D3, and NFATc1 transfection (1 or 2.5 μg)]. (D) 1,25(OH)2D3-mediated repression is enhanced by RXR. Jurkat cells were transfected with the hIL-17A promoter (−1125/+5) together with either VDR (0.3 μg) or VDR plus RXR (0.3 μg or 0.5 μg). Cells were treated as described above. Transcriptional repression observed with 1,25(OH)2D3 treatment and VDR and RXR transfection (0.3 μg or 0.5 μg) is significantly different than repression observed with 1,25(OH)2D3 treatment and transfection of VDR alone (P < 0.01). (A, B, C, and D) Error bars represent the means ± SE from at least 3 to 5 independent experiments. (E) VDR displaces NFAT from its site. EMSA was performed using NFAT site 1 (left) and NFAT site 2 (right) present within the −232-to-−159 region of hIL-17A promoter as the radiolabeled probes (see Materials and Methods). Increasing amounts of recombinant VDR (15, 30, and 60 ng; lanes 1 to 3) or VDR-RXR (10, 20, and 40 ng each; lanes 4 to 6) and 5 μg of nuclear extract from activated Jurkat cells (source of NFAT) were used. (E) Similar results were observed in 3 to 5 independent experiments. (F) Calcineurin/activated NFAT is involved in hIL-17A gene regulation. Human CD4+ T cells were polarized under Th17 conditions and treated with cyclosporine A (CsA) in the presence or absence of 1,25(OH)2D3 (10 nM). RT-PCR analysis of hIL-17A mRNA was done 5 days post-CsA treatment. Similar results were observed in two additional experiments. (Inset) Western blot analysis of NFATc1 protein levels.
Fig. 4.
Fig. 4.
VDR-RXR can occupy NFAT sites in the hIL-17A promoter in vivo. (A and B) ChIP assays were performed using HUT102 cells. HUT102 cells were transfected with VDR (1 μg) and stimulated with PMA and ionomycin in the presence or absence of 1,25(OH)2D3 (10 nM) for 4 h and cross-linked by 1% formaldehyde for 15 min. Cross-linked lysates were subjected to immunoprecipitation with NFATc1 antibody (A), VDR antibody (B), RXR antibody (B), or control rabbit IgG (A and B). DNA precipitates were isolated and then subjected to PCR using specific primers designed to amplify the −232/−159 region of the hIL-17A promoter, which contains NFAT sites. Analysis of input DNA (0.2%) was done prior to precipitation (input). For all ChIP assays in cells lines (but not in primary cells), VDR was transfected since T cells began to express VDR only 8 h postactivation (2). The bar graph represents quantification for HUT102 cells of three independent ChIP analyses (±SE). (C and D) ChIP assays were performed using human CD4+ T cells polarized under Th17 conditions. Human CD4+ T cells were activated in the presence or absence of 10 nM 1,25(OH)2D3 for 4 days. Formaldehyde cross-linked lysates were subjected to immunoprecipitation with NFAT antibody (C), VDR antibody (D), RXR antibody (D), or control rabbit IgG (C and D). DNA precipitates were isolated and subjected to PCR as described above. Similar results were observed in two additional experiments. In both HUT102 cells and primary human CD4+ T cells, PCR using the primers designed to amplify the upstream region of hIL-17A promoter −2800/−2500 (shown in panels A and C) was done as a negative control to exclude nonspecific binding. Similar results were also observed for the −3000/−2700 promoter region (not shown).
Fig. 5.
Fig. 5.
1,25(OH)2D3 recruits histone deacetylase to the hIL-17A promoter. (A) Jurkat cells were transfected with the −1125/+5 hIL-17A promoter. Posttransfection cells were rested overnight and then stimulated with PMA and ionomycin in the presence or absence of 1,25(OH)2D3 (10 nM) for 9 h with the indicated concentrations of HDAC inhibitor, trichostatin A (TSA). P < 0.01 [activation plus 1,25(OH)2D3, control versus activation plus 1,25(OH)2D3, TSA (50 and 100 nM)]. Data represent the means ± SE from 3 separate experiments. (B to E) 1,25(OH)2D3 recruits histone deacetylase to the hIL-17A. (B and C) ChIP assays were performed using HUT102 cells. HUT102 cells were stimulated with PMA and ionomycin in the presence or absence of 1,25(OH)2D3 (10 nM) for 4 h and cross-linked with 1% formaldehyde for 15 min. Cross-linked lysates were prepared and subjected to immunoprecipitation with HDAC-2 antibody (B), AcH4 antibody (C), or control rabbit IgG (B and C). DNA precipitates were isolated and then subjected to PCR using specific primers designed to amplify the −213/−158 region of the hIL-17A promoter, which contains NFAT sites. Analysis of input DNA (0.2%) was taken prior to precipitation. The bar graph represents quantification for HUT102 cells of three independent ChIP analyses (±SE). (D and E) ChIP assays were performed using CD4+ T cells polarized under Th17 conditions. Human CD4+ T cells were activated in the presence or absence of 10 nM 1,25(OH)2D3 for 4 days. Formaldehyde cross-linked lysates were subjected to immunoprecipitation with HDAC2 antibody (D), AcH4 antibody (E), or control rabbit IgG (D and E). DNA precipitates were isolated and subjected to PCR as described above. Similar results were observed in two additional experiments.
Fig. 6.
Fig. 6.
mIL-17A transcription is repressed by 1,25(OH)2D3, Runx1 relieves 1,25(OH)2D3-mediated repression, and VDR and Runx1 interact. (A) 1,25(OH)2D3 represses mIL-17A transcription. Jurkat cells transfected with the mIL-17A promoter (−2000/+5) were activated for 9 h with PMA and ionomycin in the presence of increasing concentrations of 1,25(OH)2D3. P < 0.05 [activation versus activation plus 1,25(OH)2D3 (1 and 10 nM)]. (B) Runx1 relieves 1,25(OH)2D3-mediated repression of mIL-17A transcription and enhances activation. Jurkat cells were cotransfected with the 2-kb mIL17A promoter and increasing concentrations of Runx1 expression vector or empty control vector. Cells were activated for 9 h with PMA and ionomycin in the presence or absence of 10 nM 1,25(OH)2D3. P < 0.05 [activation plus 1,25(OH)2D3, vector transfection versus activation plus 1,25(OH)2D3 Runx1 transfected (0.5, 1 and 2.5 μg)]. (A and B) The data represent the means ± SE from 3 to 6 separate experiments. (C) Runx1 is required for IL-17A expression in mouse CD4+ T cells. Mouse CD4+ T cells were isolated as described in Materials and Methods and were transfected with Runx1-specific siRNA or scrambled siRNA. Cells posttransfection were polarized under Th17 conditions in the presence or absence of 1,25(OH)2D3 (10 nM). RT-PCR analysis of mIL-17A mRNA was done 5 days post-siRNA transfection. Inhibition of mIL-17A mRNA levels by Runx1-specific siRNA was observed. (Inset) Western blot analysis of Runx1 protein levels was done to confirm knockdown of Runx1 by Runx1-specific siRNA. Similar results were observed in two additional experiments. (D and E) VDR and Runx1 interact. (D) Western blot (WB) analysis of Runx1 and VDR performed using mouse primary CD4+ T cells polarized under Th17 conditions, detected in nuclear extracts (NE) immunoprecipitated (IP) with Runx1 antibody or VDR antibody. Similar results were observed in 3 independent experiments. (E) Western blot analysis of Runx1 and VDR in HEK293 cells transfected with Runx1 and/or VDR expression vectors detected in NE immunoprecipitated with Runx1 antibody or VDR antibody. Similar results were observed in at least 3 independent experiments.
Fig. 7.
Fig. 7.
Activation-induced recruitment of Runx1 to the mIL-17A promoter is decreased in the presence of 1,25(OH)2D3. (A and B) ChIP assays were performed in EL-4 cells. EL-4 cells were transfected with VDR (1 μg), activated with PMA and ionomycin in the presence or absence of 1,25(OH)2D3 (10 nM) for 4 h, and cross-linked by 1% formaldehyde for 15 min. Cross-linked lysates were then subjected to immunoprecipitation with Runx1 antibody (A), VDR antibody (B), or control rabbit IgG (A and B). A total of 0.2% of chromatin obtained before (input) or after immunoprecipitation (IP) and were analyzed with primers specific to amplify the −1560/−1860 region of the mIL-17A promoter containing the Runx sites. The bar graph represents quantification of ChIP analyses for EL-4 cells. Data are presented as the means ± SE from three independent experiments. (C and D) ChIP assays were performed in mouse CD4+ T cells polarized under Th17 conditions. Mouse CD4+ T cells were activated in the presence or absence of 10 nM 1,25(OH)2D3 for 3 days. Formaldehyde cross-linked lysates were then subjected to immunoprecipitation with Runx1 antibody (C), VDR antibody (D), or control rabbit IgG (C and D). DNA precipitates were isolated and subjected to PCR as described above. Similar results were observed in two additional experiments. In both EL-4 cells and primary mouse CD4+ T cells, PCR using the primers designed to amplify the upstream region of mIL-17A promoter −2800/−2500 (shown in panels A and C) was done as a negative control to exclude nonspecific binding. Similar results were also observed for the −500/−200 promoter region (not shown).
Fig. 8.
Fig. 8.
1,25(OH)2D3 induces functional Treg cells, regulation of Foxp3 transcription by 1,25(OH)2D3, and identification of a VDRE in the Foxp3 promoter. 1,25(OH)2D3 induces Treg cells in vivo. EAE was induced in C57BL6/J mice, and mice were treated with either vehicle or 1,25(OH)2D3 (50 ng/mouse) for 15 days, starting on the day of EAE induction. At day 7, before disease onset, and at day 15 (peak of disease), CD4+ CD25+ Foxp3+ cells in the spleens and spinal cords were examined, respectively. (Top) CD4-gated CD25+ Foxp3+ cells induced by either vehicle or 1,25(OH)2D3 in the spleen. (Bottom) CD4-gated CD25+ Foxp3+ cells induced by either vehicle or 1,25(OH)2D3 in the spinal cord. FACS plots are representative analyses of 1 mouse out of 5 tested. (B) 1,25(OH)2D3 induces functional T effector cells. Naïve spleens were isolated from 2D2 mice and activated with MOG p35-55 (20 μg/ml) in the presence of either vehicle or 1,25(OH)2D3 (10 nM). CD4+ CD25hi T cells were then sorted from these cultures to test for their suppressive capacity in vitro. Vehicle- or 1,25(OH)2D3-treated CD4+ CD25+ T (effector) cells were cocultured with (5 × 10⁴ cells/well) naïve CD4+ CD25 T (responder) cells, sorted from naïve 2D2 spleens. T effector cells were added in titrated numbers at the T responder/T effector ratios indicated on the x axis. Cells were cultured in the presence of irradiated syngeneic APCs (2 × 10⁵ cells/well) and MOG p35-55 (20 μg/ml) for 72 h. Mean [3H]thymidine incorporation was indicated as cpm ± SE. Data are representative of 3 independent experiments. (C) 1,25(OH)2D3 induces Foxp3 expression in purified human CD4+ CD25 cells. Cells were activated with immobilized CD3 and soluble CD28 monoclonal antibodies (MAbs) in the presence or absence of 1,25(OH)2D3 (10 nM) for 6 days in RPMI 1640 medium containing rhIL-2. Intracytoplasmic analysis of Foxp3, CTLA4, and CD25 was performed on day 0 and day 6 cultures. Analysis shows the percentage of Foxp3+ and CTLA4 cells of gated CD4+ CD45RO+ CD25+ T cells. One of five representative donors is illustrated. The expression of Foxp3 was measured by flow cytometry. The bar graph represents the means ± SE of results obtained from four donors analyzed in two independent experiments. *, P < 0.05. (D) Regulation of mFoxp3 transcription by 1,25(OH)2D3. HEK-293T cells were transfected with the mFoxp3-Luc promoter −3523/+6668 or −3523/+6668 mFoxp3-Luc with the VDRE mutated at positions +2156/+2170. Cells (24 h posttransfection) were treated with 10 nM 1,25(OH)2D3 for another 24 h. Results represent the means ± SE from at least 4 separate experiments. Note the significant activation of Foxp3 transcription by 1,25(OH)2D3 (P < 0.05 [vehicle versus 1,25(OH)2D3] [mutation in the VDRE blocked the response to 1,25(OH)2D3]. (E) VDR and VDR-RXR form protein-DNA complexes on the Foxp3 core enhancer region. EMSA was performed with recombinant VDR (15 ng), RXRα (20 ng), or VDR/RXRα (15 ng each) and 32P-labeled oligonucleotides containing the putative VDRE present at positions +2156/+2170 or mutated VDRE (see Materials and Methods). Similar results were observed in at least 3 independent experiments. (F) ChIP assays were performed using mouse CD4+ T cells polarized under Treg cell conditions. Mouse CD4+ T cells were activated in the presence or absence of 10 nM 1,25(OH)2D3 for 3 days and cross-linked with 1% formaldehyde. Cross-linked cell lysates were subjected to immunoprecipitation with VDR antibody, RXR antibody, or control rabbit IgG. A total of 0.2% of chromatin obtained before (input) or after immunoprecipitation (IP) was analyzed with primers specific to amplify the +2216/+2350 region of the mFoxp3 promoter. The bar graph represents the quantification of three independent ChIP analyses (±SE). PCR using the primers designed to amplify the other regions of Foxp3 promoter −800/−500 (shown in panel F) was done as a negative control to exclude nonspecific binding. Similar results were also observed for the +1500/+1200 region (not shown).

Similar articles

Cited by

References

    1. Alarcon-Riquelme M. E. 2004. Role of RUNX in autoimmune diseases linking rheumatoid arthritis, psoriasis and lupus. Arthritis Res. Ther. 6:169–173 - PMC - PubMed
    1. Alroy I., Towers T. L., Freedman L. P. 1995. Transcriptional repression of the interleukin-2 gene by vitamin D3: direct inhibition of NFATp/AP-1 complex formation by a nuclear hormone receptor. Mol. Cell. Biol. 15:5789–5799 - PMC - PubMed
    1. Axtell R. C., et al. 2010. T helper type 1 and 17 cells determine efficacy of interferon-beta in multiple sclerosis and experimental encephalomyelitis. Nat. Med. 16:406–412 - PMC - PubMed
    1. Bettelli E., et al. 2003. Myelin oligodendrocyte glycoprotein-specific T cell receptor transgenic mice develop spontaneous autoimmune optic neuritis. J. Exp. Med. 197:1073–1081 - PMC - PubMed
    1. Bhalla A. K., Amento E. P., Clemens T. L., Holick M. F., Krane S. M. 1983. Specific high-affinity receptors for 1,25-dihydroxyvitamin D3 in human peripheral blood mononuclear cells: presence in monocytes and induction in T lymphocytes following activation. J. Clin. Endocrinol. Metab. 57:1308–1310 - PubMed

Publication types

MeSH terms