. 2011 Jul 26;108(30):12372-7.
doi: 10.1073/pnas.1109363108. Epub 2011 Jul 11.

Systematic investigation of genetic vulnerabilities across cancer cell lines reveals lineage-specific dependencies in ovarian cancer

Affiliations

Systematic investigation of genetic vulnerabilities across cancer cell lines reveals lineage-specific dependencies in ovarian cancer

Hiu Wing Cheung et al. Proc Natl Acad Sci U S A. .

Abstract

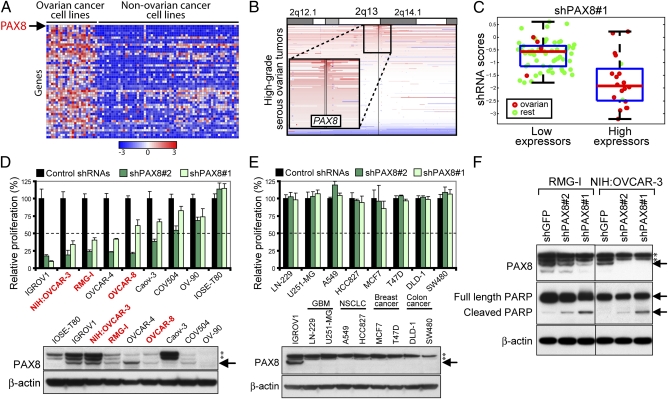
A comprehensive understanding of the molecular vulnerabilities of every type of cancer will provide a powerful roadmap to guide therapeutic approaches. Efforts such as The Cancer Genome Atlas Project will identify genes with aberrant copy number, sequence, or expression in various cancer types, providing a survey of the genes that may have a causal role in cancer. A complementary approach is to perform systematic loss-of-function studies to identify essential genes in particular cancer cell types. We have begun a systematic effort, termed Project Achilles, aimed at identifying genetic vulnerabilities across large numbers of cancer cell lines. Here, we report the assessment of the essentiality of 11,194 genes in 102 human cancer cell lines. We show that the integration of these functional data with information derived from surveying cancer genomes pinpoints known and previously undescribed lineage-specific dependencies across a wide spectrum of cancers. In particular, we found 54 genes that are specifically essential for the proliferation and viability of ovarian cancer cells and also amplified in primary tumors or differentially overexpressed in ovarian cancer cell lines. One such gene, PAX8, is focally amplified in 16% of high-grade serous ovarian cancers and expressed at higher levels in ovarian tumors. Suppression of PAX8 selectively induces apoptotic cell death of ovarian cancer cells. These results identify PAX8 as an ovarian lineage-specific dependency. More generally, these observations demonstrate that the integration of genome-scale functional and structural studies provides an efficient path to identify dependencies of specific cancer types on particular genes and pathways.


Conflict of interest statement

Conflict of interest statement: R.D., L.A.G., M.M., and W.C.H. are consultants for Novartis Pharmaceuticals.

Figures

Fig. 1.
Fig. 1.
Genome-scale RNAi screening identifies essential genes in 102 cancer cell lines. (A) Chart showing the number of cell lines from different lineages screened. (B) Unsupervised hierarchical clustering of the shRNA hybridization data obtained from quadruplicate screens of 102 cancer cell lines (various colors) and the shRNA plasmid DNA reference pool (15 replicates). A representative portion of the dendrogram is depicted at higher magnification. (C) The relative abundance 7 d after infection of OVCAR-8 cells infected with 350 individual shRNAs encoded in a GFP+ plasmid (y axis) correlates with the relative abundance (log2 fold change) of each shRNA measured in the pooled shRNA screen by microarray hybridization (x axis).
Fig. 2.
Fig. 2.
Dependencies of cell lines with mutations in KRAS, BRAF, or PIK3CA. (A, D, and G) Distribution of shRNA ranks (x axis) by the WoE scores (y axis) for the class comparisons of KRAS mutant (mut) vs. KRAS wild-type (wt) cell lines (A), BRAF mutant vs. BRAF wt (D), and PIK3CA mutant vs. PIK3CA wt (G). shRNAs targeting KRAS, BRAF, and PIK3CA are highlighted in red, and their ranks are listed. Insets report the gene ranks of KRAS, BRAF, and PIK3CA for differential essentiality in the subset of cell lines with activating mutations in those respective genes. (B, E, and H) KRAS (B), BRAF (E), or PIK3CA (H) mutation status (mutant lines in green, wt lines in gray) correlates strongly with depletion of shRNAs targeting these genes. (Lower) Heatmaps report KRAS- (B), BRAF- (E), and PIK3CA-shRNA (H) fold depletion in each cell line. (C, F, and I) Subsets of the 102 cell lines were analyzed to assess convergence of the gene dependency results for the KRAS (C), BRAF (F), and PIK3CA (I) mutant vs. wt class comparison analyses as a function of the number of cell lines tested. Distributions of the scores of the top KRAS, BRAF, and PIK3CA hit shRNAs (given as the percentile of their depletion rankings, with a smaller percentage corresponding to more depleted, y axis) in the respective cell line class comparisons (using WoE) are shown for each of 100 trials, subsampling the indicated numbers of cell lines in each class (mutant and wt). The red bar indicates the median value for each group of subsamplings, boxes represent the 25th to 75th percentile of the data, and whiskers extend to the most extreme values of the group that are not considered outliers.
Fig. 3.
Fig. 3.
Lineage-specific dependencies. (A) Heatmap of differentially antiproliferative shRNAs in cell lines from individual cancer lineages in comparison with all others. The top 20 shRNAs that distinguish each lineage from the others are displayed. (B) Ovarian-specific dependencies. Three complementary methods of gene scoring [ranking by (i) best or (ii) second best scoring shRNA or (iii) composite of all shRNAs for the gene using a KS statistic identified 582 (5.2%) genes that were selectively required for ovarian cancer cell proliferation. Fifty of these were among the 1,825 recurrently amplified genes in primary high-grade serous ovarian tumors (1). Among the 200 genes that were differentially overexpressed in ovarian cancer cell lines, 114 genes were included in the shRNA pool, and 5 genes showed enhanced essentiality in ovarian cancer lines. Twenty-two of these genes that were scored by all three gene-scoring methods were considered as high-confidence essential genes. (C) Distributions of the scores of PAX8 shRNA (given as the percentile of their rankings, y axis) after 100 trials of the ovarian vs. nonovarian WoE comparison, for equal class sizes of 1–25 (x axis; colors indicate PAX8 shRNAs 1–5). The red bar indicates the median value for each group of subsamplings, boxes represent the 25th to 75th percentile of the data, and whiskers extend to the most extreme values of the group that are not considered outliers.
Fig. 4.
Fig. 4.
PAX8 is essential for ovarian cancer cell proliferation and survival. (A) PAX8 is the top-ranked differentially expressed gene between ovarian and nonovarian cancer cell lines. Arrow indicates PAX8. (B) SNP array colorgrams depict genomic amplification of PAX8 in primary high-grade serous ovarian cancers (1). Regions of genomic amplification and deletion are denoted in red and blue, respectively. SNP array profiles derived from primary ovarian tumors were sorted based on the degree of amplification of each gene. Black vertical lines denote the boundaries of the PAX8 gene. (C) Boxplot showing significant difference in the degree of depletion of a PAX8-specific shRNA in 63 cell lines with low levels of PAX8 compared with 20 lines with high levels of PAX8 (P = 2.14 × 10⁻⁸, t test). Cell lines were divided into high- and low-expressing groups. The red line indicates the median value for each group, boxes represent the 25th to 75th percentile of the data, and whiskers extend to the most extreme values of the group that are not considered outliers. Ovarian cancer cell lines are plotted with red circles; cell lines from all other lineages are plotted with green circles. (D Upper) Effects of PAX8 suppression on proliferation in eight ovarian cancer cell lines; dotted line indicates 50% relative proliferation. (Lower) Immunoblot of PAX8 in a panel of eight ovarian cancer cell lines and in immortalized IOSE-T80 cells. Cell lines with amplification of 2q13 (log2 copy number ratio > 0.3) are marked in red. * denotes nonspecific band. (E Upper) Effects of PAX8 suppression on proliferation of cell lines from indicated cancer types. (Lower) Immunoblot of PAX8. Error bars indicate SD of six replicate measurements. (F) Immunoblot of poly(ADP-ribose) polymerase after PAX8 suppression in two 2q13-amplified cell lines. * denotes nonspecific band.

Similar articles

Cited by

References

    1. TCGA-Network. Integrated genomic analyses of ovarian carcinoma. Nature. 2011;474:609–615. - PMC - PubMed
    1. Bast RC, Jr, Hennessy B, Mills GB. The biology of ovarian cancer: New opportunities for translation. Nat Rev Cancer. 2009;9:415–428. - PMC - PubMed
    1. Luo B, et al. Highly parallel identification of essential genes in cancer cells. Proc Natl Acad Sci USA. 2008;105:20380–20385. - PMC - PubMed
    1. Good IJ. Good Thinking: The Foundations of Probability and Its Applications. Minneapolis: University of Minnesota Press; 1983.
    1. Tamayo P, et al. Predicting relapse in patients with medulloblastoma by integrating evidence from clinical and genomic features. J Clin Oncol. 2011;29:1415–1423. - PMC - PubMed

Publication types