. 2011 Jul 26;108(30):12545-50.
doi: 10.1073/pnas.1016124108. Epub 2011 Jul 11.

Plasticity of human auditory-evoked fields induced by shock conditioning and contingency reversal

Affiliations

Plasticity of human auditory-evoked fields induced by shock conditioning and contingency reversal

Christian Kluge et al. Proc Natl Acad Sci U S A. .

Abstract

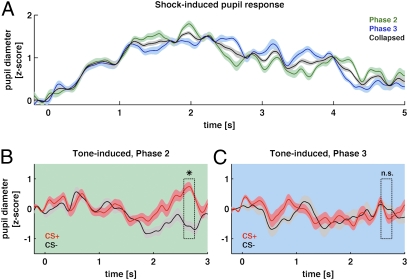
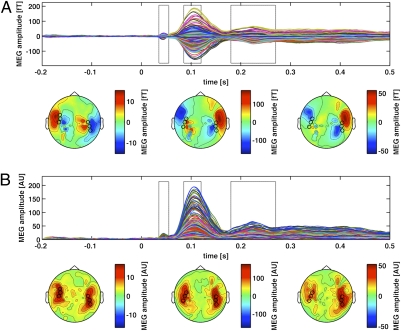
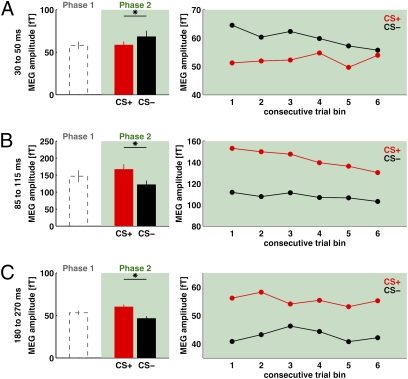
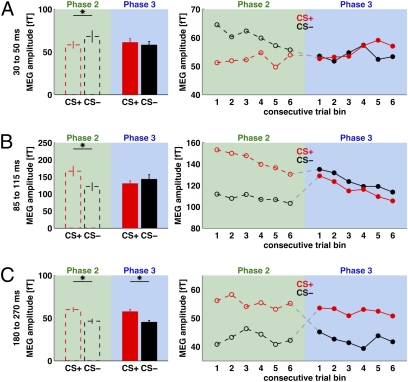
We used magnetoencephalography (MEG) to assess plasticity of human auditory cortex induced by classical conditioning and contingency reversal. Participants listened to random sequences of high or low tones. A first baseline phase presented these without further associations. In phase 2, one of the frequencies (CS(+)) was paired with shock on half its occurrences, whereas the other frequency (CS(-)) was not. In phase 3, the contingency assigning CS(+) and CS(-) was reversed. Conditioned pupil dilation was observed in phase 2 but extinguished in phase 3. MEG revealed that, during phase-2 initial conditioning, the P1m, N1m, and P2m auditory components, measured from sensors over auditory temporal cortex, came to distinguish between CS(+) and CS(-). After contingency reversal in phase 3, the later P2m component rapidly reversed its selectivity (unlike the pupil response) but the earlier P1m did not, whereas N1m showed some new learning but not reversal. These results confirm plasticity of human auditory responses due to classical conditioning, but go further in revealing distinct constraints on different levels of the auditory hierarchy. The later P2m component can reverse affiliation immediately in accord with an updated expectancy after contingency reversal, whereas the earlier auditory components cannot. These findings indicate distinct cognitive and emotional influences on auditory processing.


Conflict of interest statement

The authors declare no conflict of interest.

Figures

Fig. 1.
Fig. 1.
(A) Grand mean pupil diameter (as z scores) plotted against time since shock-US onset, shown for initial conditioning phase 2 (in green), for contingency reversal phase 3 (in blue), and also pooled across these two phases (shown in black). For both phases 2 and 3, the shock-US consistently induced pupil dilation as an unconditioned response (UR), which peaked ∼2 s after shock-US onset. Thus, the pupil UR did not habituate away in phase 3 versus phase 2, i.e., the shock-US remained potent. (B) Grand mean pupil diameters (again as z scores), now plotted against time since onset of the tone (CS+ or CS), for phase 2. Note that CS+ induces significantly larger pupil dilation (now as a conditioned response, CR) than CS in phase 2, peaking around ∼2.6 s after sound onset. (C) Pupil diameter did not show a consistent conditioned response to the (reassigned) CS+ versus CS in phase 3 following contingency reversal; rather the pupil CR became “extinguished” (main text).
Fig. 2.
Fig. 2.
(A, Upper) Butterfly plot for all MEG channels, time locked (at 0 along the x axis) to tone onset, collapsing across auditory frequency, in the preconditioning trials of phase 1 (i.e., before any shock was introduced), across participants. Note the clear response to the tone in the three time windows indicated (30–50, 85–115, and 180–270 ms). Mean topographies are shown below for these three time windows (now successively ordered left to right). (B) Data now replotted as planar gradients, with same time windows indicated. The black circles on the topographies indicate the sensors of interest selected from these preconditioning auditory responses, for each of the three time windows, as described in the main text. For completeness, these same selected sensors are also shown for the topographies in A. Note that the three components of interest (P1m, N1m, and P2m; see main text) each exhibit clear dipolar patterns (A), with maxima over temporal sites as confirmed in B, all as expected, given many previous auditory MEG studies on these components.
Fig. 3.
Fig. 3.
(A) Bar plot (Left) shows intersubject mean P1m amplitude across the sensors of interest, collapsed across both tones before any conditioning (to provide a phase-1 baseline; dashed bar at far left) as well as for CS+ (red) or CS (black) in the initial conditioning phase 2. Note the significant difference between CS+ and CS for phase 2, indicating a conditioning influence on this early auditory response. The line graph (Right) shows P1m amplitude for CS+ or CS across six successive “bins” of trials within phase 2, confirming that the conditioning influence was present from the very first such bin. (B) Results for the N1m component, showing a significant conditioning influence overall for phase 2 in the bar plot (now taking the form of higher amplitude for CS+ than CS). The line graph (Right) confirms that this conditioning effect on N1m was again present from the first bin of trials and was then sustained across the subsequent five further bins of trials in phase 2. (C) Results for the P2m component, showing a similar conditioning effect in phase 2 as for the N1m component.
Fig. 4.
Fig. 4.
The dashed lines within the bar plots and line graphs (shown on green backgrounds here) are data replotted from phase 2 (Fig. 3), shown again here to allow visual comparison with the new data subsequently acquired in phase 3 (shown here with filled bars, filled points and solid lines, against blue backgrounds) after the contingency reversal. Please note that CS+ and CS (results shown in red or black) are coded here in terms of the current shock contingency. Thus, the particular tone frequency that served as CS+ during phase 2 actually became the CS during phase 3, and vice versa. (A) Amplitude data for the P1m; (B) for the N1m; and (C) for the P2m. Note the different patterns of results for phase 2 versus phase 3. In phase 2, all three components (P1m, N1m, and P2m) came readily to distinguish CS+ and CS, from the very first bin of trials. For phase 3, the P2m rapidly reversed its affiliation following the contingency change (C). The N1m showed some new learning but never reversed its affiliation (B). The P1m did not show significant reversal learning (the apparent trend for some crossover in bins 5 and 6 of phase 3 for P1m was far from reliable, P > 0.7). P1m showed no reliable CS+/CS differentiation for phase 3, unlike phase 2.

Similar articles

Cited by

References

    1. Edeline JM, Weinberger NM. Receptive field plasticity in the auditory cortex during frequency discrimination training: Selective retuning independent of task difficulty. Behav Neurosci. 1993;107:82–103. - PubMed
    1. Bakin JS, Weinberger NM. Classical conditioning induces CS-specific receptive field plasticity in the auditory cortex of the guinea pig. Brain Res. 1990;536:271–286. - PubMed
    1. Diamond DM, Weinberger NM. Classical conditioning rapidly induces specific changes in frequency receptive fields of single neurons in secondary and ventral ectosylvian auditory cortical fields. Brain Res. 1986;372:357–360. - PubMed
    1. Weinberger NM. Specific long-term memory traces in primary auditory cortex. Nat Rev Neurosci. 2004;5:279–290. - PMC - PubMed
    1. Irvine DRF. Auditory cortical plasticity: Does it provide evidence for cognitive processing in the auditory cortex? Hear Res. 2007;229:158–170. - PMC - PubMed

Publication types

LinkOut - more resources