

Recent ecological responses to climate change support predictions of high extinction risk
- PMID: 21746924
- PMCID: PMC3145734
- DOI: 10.1073/pnas.1017352108
Recent ecological responses to climate change support predictions of high extinction risk
Abstract
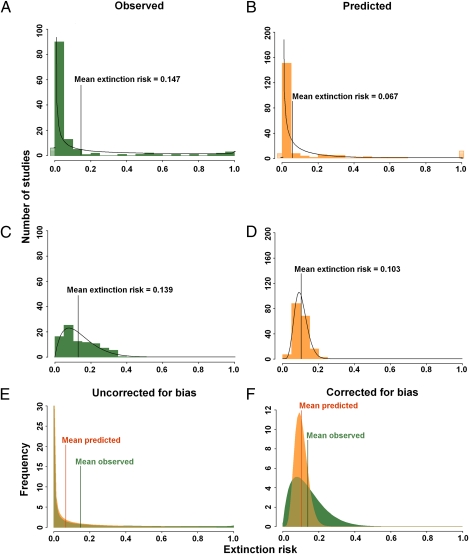
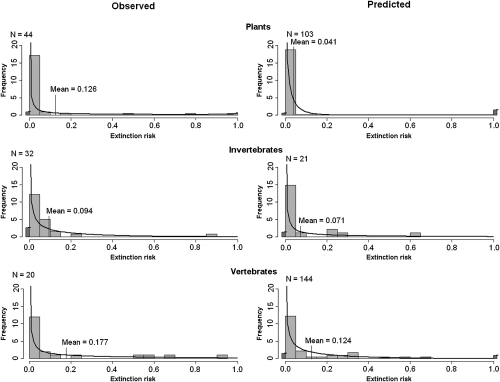
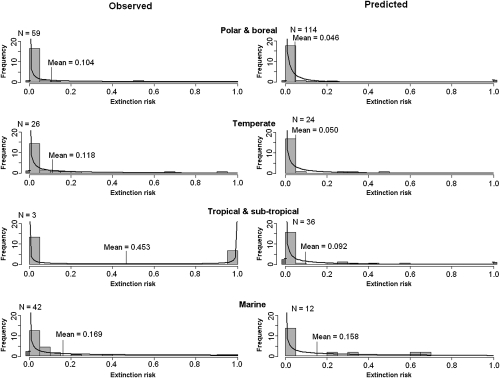
Predicted effects of climate change include high extinction risk for many species, but confidence in these predictions is undermined by a perceived lack of empirical support. Many studies have now documented ecological responses to recent climate change, providing the opportunity to test whether the magnitude and nature of recent responses match predictions. Here, we perform a global and multitaxon metaanalysis to show that empirical evidence for the realized effects of climate change supports predictions of future extinction risk. We use International Union for Conservation of Nature (IUCN) Red List criteria as a common scale to estimate extinction risks from a wide range of climate impacts, ecological responses, and methods of analysis, and we compare predictions with observations. Mean extinction probability across studies making predictions of the future effects of climate change was 7% by 2100 compared with 15% based on observed responses. After taking account of possible bias in the type of climate change impact analyzed and the parts of the world and taxa studied, there was less discrepancy between the two approaches: predictions suggested a mean extinction probability of 10% across taxa and regions, whereas empirical evidence gave a mean probability of 14%. As well as mean overall extinction probability, observations also supported predictions in terms of variability in extinction risk and the relative risk associated with broad taxonomic groups and geographic regions. These results suggest that predictions are robust to methodological assumptions and provide strong empirical support for the assertion that anthropogenic climate change is now a major threat to global biodiversity.
Conflict of interest statement
The authors declare no conflict of interest.
Figures
References
-
- Thomas CD, et al. Extinction risk from climate change. Nature. 2004;427:145–148. - PubMed
-
- Pounds JA, et al. Widespread amphibian extinctions from epidemic disease driven by global warming. Nature. 2006;439:161–167. - PubMed
-
- Parry ML, Canziani OF, Palutikof JP, van der Linden PJ, Hanson CE, editors. Contribution of Working Group II to the Fourth Assessment Report of the Intergovernmental Panel on Climate Change. Cambridge, UK: Cambridge University Press; 2007.
-
- Araujo MB, Pearson RG, Thuiller W, Erhard M. Validation of species-climate impact models under climate change. Glob Change Biol. 2005;11:1504–1513.
Publication types
MeSH terms
LinkOut - more resources
Full Text Sources
Medical
