. 2011 Jul 26;108(30):12533-8.
doi: 10.1073/pnas.1019732108. Epub 2011 Jul 11.

Genome-wide landscape of polyadenylation in Arabidopsis provides evidence for extensive alternative polyadenylation

Affiliations

Genome-wide landscape of polyadenylation in Arabidopsis provides evidence for extensive alternative polyadenylation

Xiaohui Wu et al. Proc Natl Acad Sci U S A. .

Abstract

Alternative polyadenylation (APA) has been shown to play an important role in gene expression regulation in animals and plants. However, the extent of sense and antisense APA at the genome level is not known. We developed a deep-sequencing protocol that queries the junctions of 3'UTR and poly(A) tails and confidently maps the poly(A) tags to the annotated genome. The results of this mapping show that 70% of Arabidopsis genes use more than one poly(A) site, excluding microheterogeneity. Analysis of the poly(A) tags reveal extensive APA in introns and coding sequences, results of which can significantly alter transcript sequences and their encoding proteins. Although the interplay of intron splicing and polyadenylation potentially defines poly(A) site uses in introns, the polyadenylation signals leading to the use of CDS protein-coding region poly(A) sites are distinct from the rest of the genome. Interestingly, a large number of poly(A) sites correspond to putative antisense transcripts that overlap with the promoter of the associated sense transcript, a mode previously demonstrated to regulate sense gene expression. Our results suggest that APA plays a far greater role in gene expression in plants than previously expected.


Conflict of interest statement

The authors declare no conflict of interest.

Figures

Fig. 1.
Fig. 1.
Genome-wide distribution of sense PACs. Various genomic regions defined by the TAIR9 annotation of the Arabidopsis genome (45) are listed above the representation of a generic gene. The percent of all sense PACs that fall within these regions is listed beneath the representation. The bracket that encompasses the 3′UTR and adjacent portion of the intergenic region is meant to emphasize that the corresponding value is for PACs that fall within the annotated 3′UTR as well as the adjacent, downstream 120 nt.
Fig. 2.
Fig. 2.
Position-by-position analysis of average base composition of the regions surrounding PACs within different genomic regions. (A) An χ2 analysis. For this analysis, the negative log of the χ2 metric was plotted as a function of position relative to the principal poly(A) in the PAC, with negative positions denoting upstream sequences and positive positions downstream sequences. The χ2 metric was calculated using the values for base composition of 3′UTR PACs (B) as the “expected” value. (B) Position-by-position base composition of PACs that map to 3′UTRs. (C) Position-by-position base composition of PACs that map to protein-coding regions. Plots in B and C were generated as described previously (24).
Fig. 3.
Fig. 3.
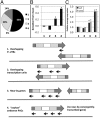
Classification of antisense PACs that map to annotated genes. The four classes mentioned in the text are illustrated and numbered as shown. In these representations, the “color-coding” of different regions (CDS, intron, and so forth) is as in Fig. 1, and the positions of hypothetical antisense PACs shown with arrows beneath each drawing. The presence of multiple arrows means that the results for antisense PACs that map to each of the corresponding genomic regions have been pooled. (A) Pie chart that summarizes the distribution of antisense PACs among the four classes. (B) Average stabilities of mRNAs encoded by the sense “targets” of the different classes of antisense PACs. The values plotted are the deviation from the global mean; less-stable mRNAs will have negative values, and more stable mRNAs have positive values. (C) Average expression levels of the sense “targets” of the various classes of antisense PAC. The values plotted are the ratio of the average expression metric for each class divided by the global average. In B and C, the asterisk denotes values that are significantly different from the global average at the P < 0.01 level. Also in B and C, numbers along the x axis denote the cases illustrated beneath the plots.
Fig. 4.
Fig. 4.
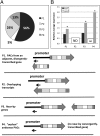
Classification of antisense PACs that map to promoters of annotated genes. The four classes mentioned in the text are illustrated and numbered as shown. As in Fig. 3, the presence of multiple arrows means that the results for antisense PACs that map to each of the corresponding genomic regions have been pooled. (A) Pie chart that summarizes the distribution of antisense PACs among the four classes. (B) Average expression levels of the sense “targets” of the various classes of antisense PAC. The values plotted are the ratio of the average expression metric for each class divided by the global average. The asterisk denotes values that are significantly different from the global average at the P < 0.01 level. In B, numbers along the x axis denote the cases illustrated beneath the plots.

References

    1. Lee JY, Yeh I, Park JY, Tian B. PolyA_DB 2: mRNA polyadenylation sites in vertebrate genes. Nucleic Acids Res. 2007;35(Database issue):D165–D168. - PMC - PubMed
    1. Meyers BC, et al. Analysis of the transcriptional complexity of Arabidopsis thaliana by massively parallel signature sequencing. Nat Biotechnol. 2004;22:1006–1011. - PubMed
    1. Shen Y, et al. Genome level analysis of rice mRNA 3′-end processing signals and alternative polyadenylation. Nucleic Acids Res. 2008;36:3150–3161. - PMC - PubMed
    1. Tian B, Hu J, Zhang H, Lutz CS. A large-scale analysis of mRNA polyadenylation of human and mouse genes. Nucleic Acids Res. 2005;33:201–212. - PMC - PubMed
    1. Tian B, Pan Z, Lee JY. Widespread mRNA polyadenylation events in introns indicate dynamic interplay between polyadenylation and splicing. Genome Res. 2007;17:156–165. - PMC - PubMed

Publication types

LinkOut - more resources