

Autoimmune regulator (AIRE)-deficient CD8+CD28low regulatory T lymphocytes fail to control experimental colitis
- PMID: 21746930
- PMCID: PMC3145727
- DOI: 10.1073/pnas.1107136108
Autoimmune regulator (AIRE)-deficient CD8+CD28low regulatory T lymphocytes fail to control experimental colitis
Abstract
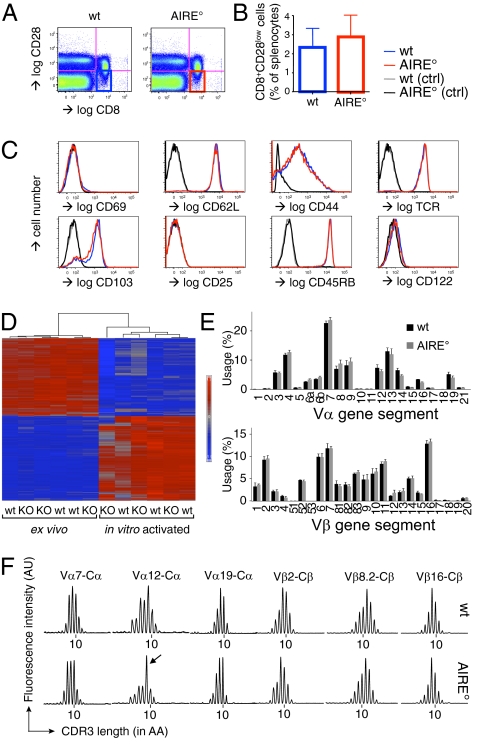
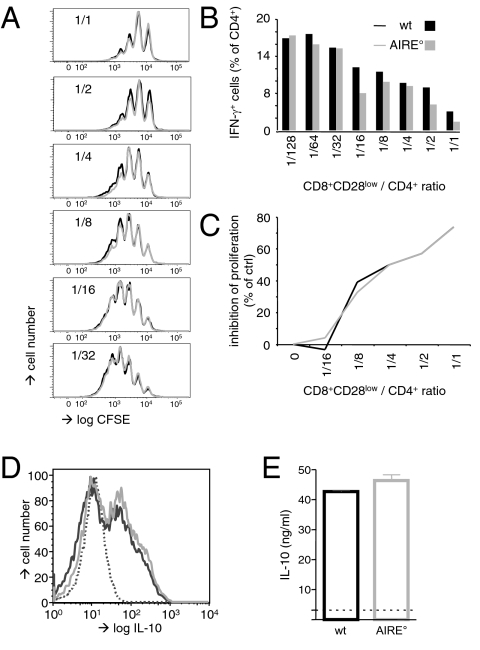
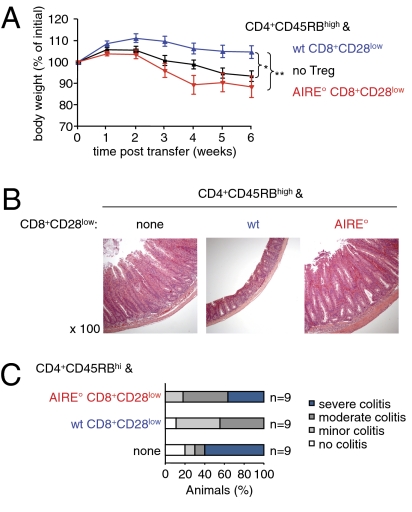
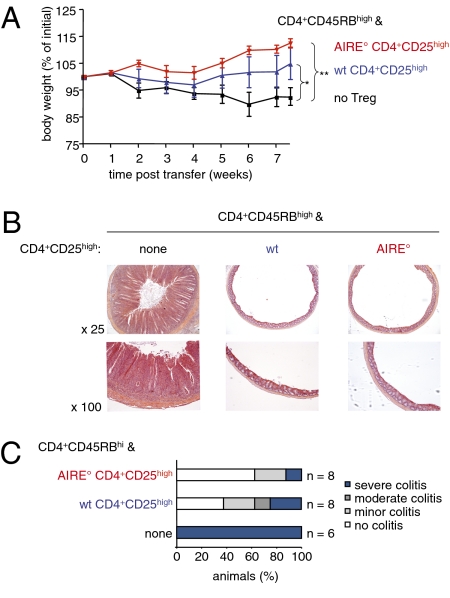
Mutations in the gene encoding the transcription factor autoimmune regulator (AIRE) are responsible for autoimmune polyendocrinopathy candidiasis ectodermal dystrophy syndrome. AIRE directs expression of tissue-restricted antigens in the thymic medulla and in lymph node stromal cells and thereby substantially contributes to induction of immunological tolerance to self-antigens. Data from experimental mouse models showed that AIRE deficiency leads to impaired deletion of autospecific T-cell precursors. However, a potential role for AIRE in the function of regulatory T-cell populations, which are known to play a central role in prevention of immunopathology, has remained elusive. Regulatory T cells of CD8(+)CD28(low) phenotype efficiently control immune responses in experimental autoimmune and colitis models in mice. Here we show that CD8(+)CD28(low) regulatory T lymphocytes from AIRE-deficient mice are transcriptionally and phenotypically normal and exert efficient suppression of in vitro immune responses, but completely fail to prevent experimental colitis in vivo. Our data therefore demonstrate that AIRE plays an important role in the in vivo function of a naturally occurring regulatory T-cell population.
Conflict of interest statement
The authors declare no conflict of interest.
Figures
Similar articles
-
T-cell regulation by casitas B-lineage lymphoma (Cblb) is a critical failsafe against autoimmune disease due to autoimmune regulator (Aire) deficiency.Proc Natl Acad Sci U S A. 2010 Aug 17;107(33):14709-14. doi: 10.1073/pnas.1009209107. Epub 2010 Jul 28. Proc Natl Acad Sci U S A. 2010. PMID: 20668237 Free PMC article.
-
A defect of regulatory T cells in patients with autoimmune polyendocrinopathy-candidiasis-ectodermal dystrophy.J Immunol. 2007 Jan 15;178(2):1208-15. doi: 10.4049/jimmunol.178.2.1208. J Immunol. 2007. PMID: 17202386
-
Normal thymic architecture and negative selection are associated with Aire expression, the gene defective in the autoimmune-polyendocrinopathy-candidiasis-ectodermal dystrophy (APECED).J Immunol. 2000 Aug 15;165(4):1976-83. doi: 10.4049/jimmunol.165.4.1976. J Immunol. 2000. PMID: 10925280
-
AIRE and immunological tolerance: insights from the study of autoimmune polyendocrinopathy candidiasis and ectodermal dystrophy.Curr Opin Allergy Clin Immunol. 2004 Dec;4(6):491-6. doi: 10.1097/00130832-200412000-00004. Curr Opin Allergy Clin Immunol. 2004. PMID: 15640689 Review.
-
AIRE deficiency, from preclinical models to human APECED disease.Dis Model Mech. 2021 Feb 5;14(2):dmm046359. doi: 10.1242/dmm.046359. Dis Model Mech. 2021. PMID: 33729987 Free PMC article. Review.
Cited by
-
Aire-dependent transcripts escape Raver2-induced splice-event inclusion in the thymic epithelium.EMBO Rep. 2022 Feb 3;23(3):e53576. doi: 10.15252/embr.202153576. Epub 2022 Jan 17. EMBO Rep. 2022. PMID: 35037357 Free PMC article.
-
CD28- and CD28lowCD8+ Regulatory T Cells: Of Mice and Men.Front Immunol. 2017 Jan 23;8:31. doi: 10.3389/fimmu.2017.00031. eCollection 2017. Front Immunol. 2017. PMID: 28167946 Free PMC article. Review.
-
Twenty Years of AIRE.Front Immunol. 2018 Feb 12;9:98. doi: 10.3389/fimmu.2018.00098. eCollection 2018. Front Immunol. 2018. PMID: 29483906 Free PMC article. Review.
-
Thymic Germinal Centers and Corticosteroids in Myasthenia Gravis: an Immunopathological Study in 1035 Cases and a Critical Review.Clin Rev Allergy Immunol. 2017 Feb;52(1):108-124. doi: 10.1007/s12016-016-8558-3. Clin Rev Allergy Immunol. 2017. PMID: 27273086 Review.
-
Post-Aire maturation of thymic medullary epithelial cells involves selective expression of keratinocyte-specific autoantigens.Front Immunol. 2012 Mar;3(March):19. doi: 10.3389/fimmu.2012.00019. Front Immunol. 2012. PMID: 22448160 Free PMC article.
References
-
- Hogquist KA, Baldwin TA, Jameson SC. Central tolerance: Learning self-control in the thymus. Nat Rev Immunol. 2005;5:772–782. - PubMed
-
- Bouneaud C, Kourilsky P, Bousso P. Impact of negative selection on the T cell repertoire reactive to a self-peptide: A large fraction of T cell clones escapes clonal deletion. Immunity. 2000;13:829–840. - PubMed
-
- Mueller DL. Mechanisms maintaining peripheral tolerance. Nat Immunol. 2010;11:21–27. - PubMed
-
- Pomié C, Ménager-Marcq I, van Meerwijk JP. Murine CD8+ regulatory T lymphocytes: The new era. Hum Immunol. 2008;69:708–714. - PubMed
Publication types
MeSH terms
Substances
LinkOut - more resources
Full Text Sources
Molecular Biology Databases
Research Materials
