. 2011 Jul 26;108(30):12515-20.
doi: 10.1073/pnas.1105929108. Epub 2011 Jul 11.

Related pituitary cell lineages develop into interdigitated 3D cell networks

Affiliations

Related pituitary cell lineages develop into interdigitated 3D cell networks

Lionel Budry et al. Proc Natl Acad Sci U S A. .

Abstract

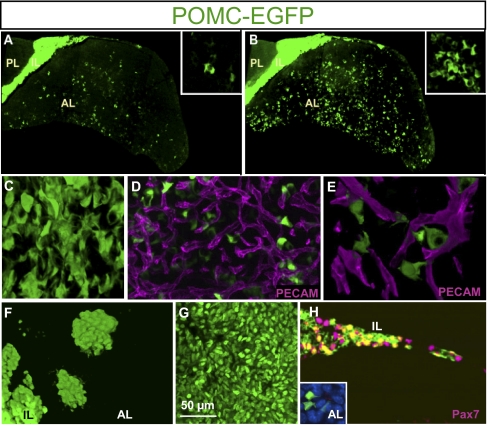
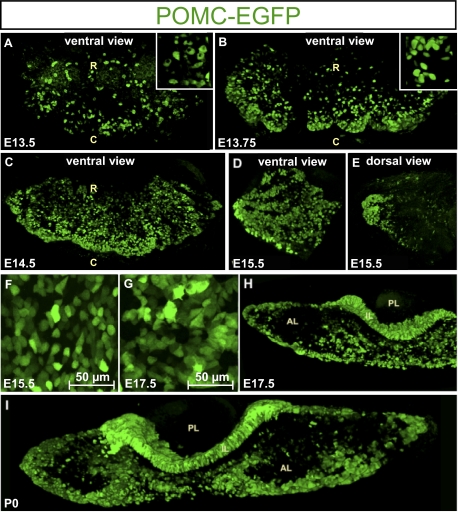
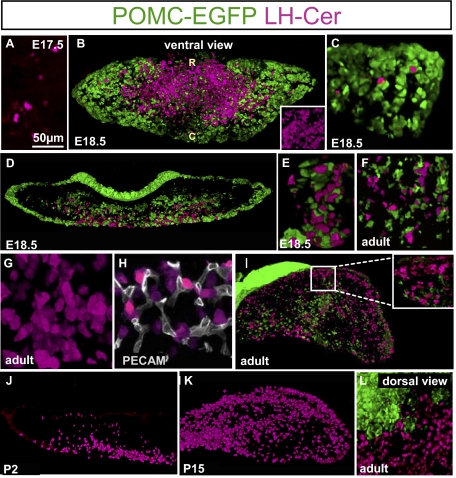
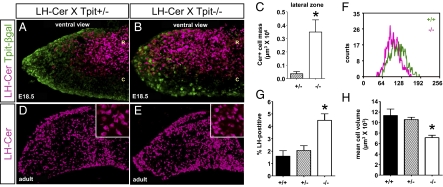
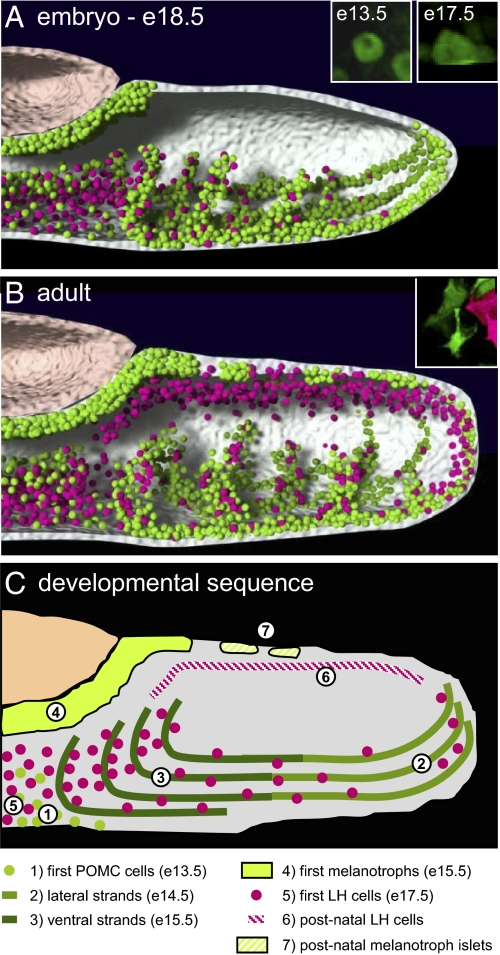
The pituitary gland has long been considered to be a random patchwork of hormone-producing cells. By using pituitary-scale tridimensional imaging for two of the least abundant cell lineages, the corticotropes and gonadotropes, we have now uncovered highly organized and interdigitated cell networks that reflect homotypic and heterotypic interactions between cells. Although newly differentiated corticotrope cells appear on the ventral surface of the gland, they rapidly form homotypic strands of cells that extend from the lateral tips of the anterior pituitary along its ventral surface and into the medial gland. As the corticotrope network is established away from the microvasculature, cell morphology changes from rounded, to polygonal, and finally to cells with long cytoplasmic processes or cytonemes that connect corticotropes to the perivascular space. Gonadotropes differentiate later and are positioned in close proximity to corticotropes and capillaries. Blockade of corticotrope terminal differentiation produced by knockout of the gene encoding the transcription factor Tpit results in smaller gonadotropes within an expanded cell network, particularly in the lateral gland. Thus, pituitary-scale tridimensional imaging reveals highly structured cell networks of unique topology for each pituitary lineage. The sequential development of interdigitated cell networks during organogenesis indicate that extensive cell:cell interactions lead to a highly ordered cell positioning rather than random patchwork.


Conflict of interest statement

The authors declare no conflict of interest.

Figures

Fig. 1.
Fig. 1.
Tridimensional organization of POMC cells in adult mouse pituitary. (A) Distribution of POMC–EGFP fluorescence on 5-μm coronal section through an adult (P70) mouse pituitary revealing homogenously stained IL, negative posterior lobe (PL), and discontinuous fragments of fluorescent cytoplasm in AL. The x, y, and z axes are 960, 1,705, and 5 μm, respectively; inset is 100 × 100 × 5 μm. (B) Similar view of POMC–EGFP pituitary following 3D reconstruction (depth, 70 μm) of images obtained by two-photon confocal microscopy. Insets in A and B represent high-magnification views of the same pituitary field in 2D and 3D, respectively. The x, y, and z axes are 960, 1,705, and 70 μm, respectively; inset is 100 × 100 × 70 μm. (C) Higher-magnification 3D reconstruction of POMC–EGFP cell network viewed from ventral AL (Movie S1). The x, y, and z axes are 126, 126, and 57 μm, respectively. (D) Three-dimensional reconstruction of fluorescent coimaging of POMC–EGFP cells (green) with PECAM (CD31) labeling of endothelial cells revealing capillary bed of adult AL. The x, y, and z axes are 156, 100, and 20 μm, respectively. (E) High-magnification 3D reconstruction of capillaries with PECAM (magenta) together with POMC–EGFP fluorescence. The x, y, and z axes are 62, 46, and 16 μm, respectively. (F) Dorsal view of adult mouse pituitary revealing islets of very intense EGFP-positive cells. The x, y, and z axes are 228, 181, and 94 μm, respectively. (G) High-resolution view of tightly packed IL melanotrope cells positive for POMC–EGFP. (H) Colabeling of adult POMC–EGFP pituitary for Pax7 (magenta) and POMC–EGFP. Coexpression (yellow) is observed in IL but not in AL (Inset). The x, y, and z axes are 204, 134, and 4 μm; inset is 34 × 31 × 4 μm.
Fig. 2.
Fig. 2.
Developmental dynamics of POMC cell morphology and network organization. (A) Ventral view of E13.5 POMC–EGFP mouse pituitary in which the first fluorescent signal appears as small and isolated cells (Inset). R, rostral; C, caudal. The x, y, and z axes are 540, 258, and 199 μm, respectively; inset is 62 × 62 × 199 μm. (B) By E13.75, POMC–EGFP–positive cells appear to regroup on the caudal side of the ventral surface (Inset). The x, y, and z axes are 916, 438, and 151 μm; inset is 62 × 62 × 151 μm. (C) At E14.5, densely packed POMC–EGFP cells are seen on the caudal–ventral side of the AL. The x, y, and z axes are 1,126, 584, and 205 μm, respectively. (D) At E15.5, strands of POMC–EGFP cells extend from the lateral tip of the AL along its ventral surface. The x, y, and z axes are 368, 368, and 107 μm. (E) These strands of POMC–EGFP cells come together at the lateral tip of the AL but do not extend on the dorsal side of the gland. The x, y, and z axes are 368, 368, and 85 μm, respectively. (F) POMC–EGFP cells of E15.5 pituitary have more polygonal appearance than at E13.5. (G) By E17.5, the POMC–EGFP cells extend cytoplasmic projections that maintain contacts between different POMC–EGFP cells. (H) Coronal section through E17.5 POMC–EGFP pituitary shows strands of fluorescent cells extending from ventral surface of the AL into the mediolateral sides of the gland. The x, y, and z axes are 980, 518, and 106 μm, respectively. (I) A similar organization is present in the P0 postnatal pituitary. The x, y, and z axes are 1,788, 453, and 103 μm, respectively.
Fig. 3.
Fig. 3.
Development of LH cell network during pituitary organogenesis. (A) The first LH-cerulean (LH-Cer, magenta) cells appear at E17.5 as small cells on the ventral surface of the AL. (B) Ventral view of double E18.5 transgenic pituitary for POMC–EGFP (green) and LH-cerulean show initial appearance of LH-cerulean cells in the rostromedial AL, in contrast to POMC–EGFP cells that are more preeminent in the lateral wings. (R, rostral; C, caudal.) The x, y, and z axes are 1,374, 612, and 160 μm, respectively; inset is 124 × 124 × 160 μm. (C) View of lateral wing of E18.5 double transgenic pituitary revealing few scattered LH-cerulean cells in intimate contact with strands of POMC–EGFP cells. The x, y, and z axes are 318, 318, and 160 μm, respectively. (D) Coronal section through E18.5 double transgenic pituitary. Whereas POMC–EGFP cells are mostly present along the edges of the developing AL, the LH-cerulean cells extend from the medioventral surface into the ventral half of the developing AL. The x, y, and z axes are 1,750, 613, and 102 μm, respectively. (E) High-magnification view of E18.5 double transgenic pituitary shows intimate contacts between LH-cerulean cells and strands of POMC–EGFP cells penetrating the AL. The x, y, and z axes are 125, 77, and 102 μm, respectively. (F) Close contacts between LH-cerulean cells and strands of POMC–EGFP cells penetrating the AL are preserved in adulthood (P70 double transgenic male). The x, y, and z axes are 225, 225, and 41 μm, respectively. (G) Higher-magnification 3D reconstruction of LH-cerulean cell network viewed from ventral AL (Movie S2). The x, y, and z axes are 125, 125, and 82 μm, respectively. (H) Colabeling for endothelial PECAM (CD31) and LH-cerulean reveals intimate contacts between gonadotropes and pituitary capillaries (P70). The x, y, and z axes are 111, 106, and 30 μm, respectively. (I) Adult (P70) double transgenic male pituitary revealing the presence of a dorsal population of LH-cerulean cells that form a continuous band of gonadotropes along the dorsal side of the AL. Inset: These dorsal LH-cerulean cells have few contacts with POMC–EGFP cells. The x, y, and z axes are 1,902, 1,000, and 56 μm, respectively; inset is 225 × 225 × 46 μm. (J) At P2, the LH cell network remains concentrated along the medioventral AL and the first LH cells are detected in the dorsal AL. The x, y, and z axes are 1,070, 580, and 127 μm, respectively. (K) Three-dimensional reconstruction of LH-cerulean cells in AL of P15 pituitary reveals intimate contacts between dorsal gonadotropes. The x, y, and z axes are 833, 489, and 135 μm, respectively. (L) Dorsal view of adult (P70) double transgenic pituitary shows high density of LH-cerulean cells that are contiguous with the homogenous POMC–EGFP–positive IL. The x, y, and z axes are 332, 360, and 100 μm, respectively.
Fig. 4.
Fig. 4.
Extended LH cell network, but decreased cell volume, in corticotrope-deficient Tpit−/− pituitary. (A and B) LH-cerulean–positive cells (magenta) present in rostromedial AL of control Tpit+/−;LH-cerulean pituitary extend laterally in Tpit/;LH-cerulean mice. Immunostaining for the Tpit–β-gal chimeric protein derived from the mutant Tpit allele (green) reveals cells destined for corticotrope lineage. (R, rostral; C, caudal.) The x, y, and z axes in A are 729, 516, and 67 μm, respectively; those in B are 719, 516, and 103 μm, respectively. (C) Morphometric quantitation of LH-cerulean–positive cells in the lateral quarters of the developing AL (mean ± SEM; n = 5). Statistical analysis (Mann–Whitney) indicates statistical difference (P = 0.009). (D and E) Adult LH-cerulean transgenic pituitary reveals increased number of gonadotropes in AL of Tpit/ compared with Tpit+/ mice. Insets: LH-cerulean–positive cells of Tpit−/− pituitary may be smaller. The x, y, and z axes in D and E are 966, 680, and 105 μm, respectively; inset is 100 × 100 × 69 μm. (F) FACS analysis of LH-cerulean–positive cells from WT (+/+) and Tpit/ pituitaries revealing smaller cell size in Tpit/ pituitary (magenta). (G) Quantification by FACS of LH-cerulean–positive cells as percentage of sorted AL cells showing increased number of gonadotrope cells in Tpit−/− pituitaries (P = 0.02, Kruskal–Wallis one-way ANOVA; Tpit+/+, n = 3; Tpit+/−, n = 5; Tpit−/−, n = 5; mean ± SEM). (H) Cell volume assessed by FACS for adult LH-cerulean cells of the same Tpit genotypes as before show a statistically significant decrease of approximately 40% cell volume in Tpit−/− pituitaries (P = 0.03, Kruskal–Wallis one-way ANOVA).
Fig. 5.
Fig. 5.
Schematic representation of POMC (green) and LH (magenta) cell networks in developing E18.5 (A) and adult pituitary (B). Insets: Photographs of POMC (green) and LH (red) cells at indicated times of development to illustrate changes in cell shape. (C) Developmental sequence of appearance/changes in POMC and LH cell networks. 1, The first POMC cells appear on ventral AL at approximately E13.5. 2, By E14.5, strands of POMC cells extend from lateral tips of the AL along the ventral surface. 3, The ventral strands of POMC cells penetrate the AL. 4, The first IL melanotropes appear at E15.5. 5, The first LH cells appear on ventral AL surface at E17.5 and populate medial AL. 6, Postnatal appearance of LH cell network on dorsal side of AL. These postnatal LH cells have few contacts with POMC cells. 7, Postnatal appearance of POMC- and Pax7-positive melanotrope islets on dorsal surface of AL.

Similar articles

Cited by

References

    1. Melmed S, Drouin J. Pituitary development. In: Melmed S, editor. The Pituitary. Oxford: Academic Press; 2010. pp. 3–19.
    1. Fauquier T, Rizzoti K, Dattani M, Lovell-Badge R, Robinson IC. SOX2-expressing progenitor cells generate all of the major cell types in the adult mouse pituitary gland. Proc Natl Acad Sci USA. 2008;105:2907–2912. - PMC - PubMed
    1. Harris GW. The function of the pituitary stalk. Bull Johns Hopkins Hosp. 1955;97:358–375. - PubMed
    1. Schally AV. Aspects of hypothalamic regulation of the pituitary gland. Science. 1978;202:18–28. - PubMed
    1. Guillemin R. Peptides in the brain: The new endocrinology of the neuron. Science. 1978;202:390–402. - PubMed

Publication types

MeSH terms

Substances