. 2011 Aug 15;187(4):1835-44.
doi: 10.4049/jimmunol.1100207. Epub 2011 Jul 11.

Selection of individual VH genes occurs at the pro-B to pre-B cell transition

Affiliations

Selection of individual VH genes occurs at the pro-B to pre-B cell transition

Wenzhao Meng et al. J Immunol. .

Abstract

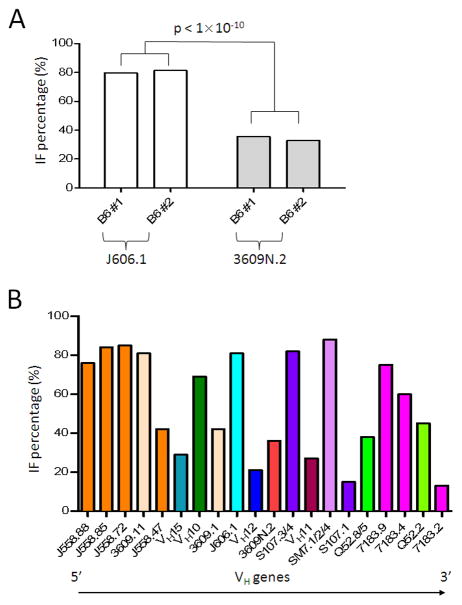
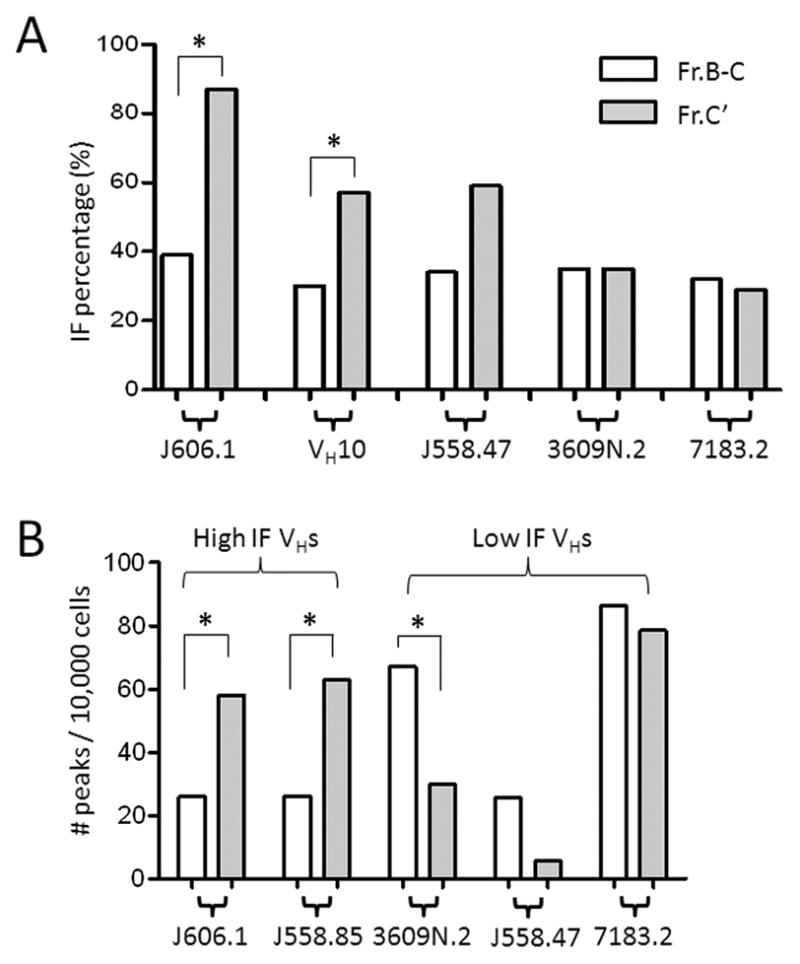
B cells are subjected to selection at multiple checkpoints during their development. The selection of Ab H chains is difficult to study because of the large diversity of the CDR3. To study the selection of individual Ab H chain V region genes (V(H)), we performed CDR3 spectratyping of ∼ 75-300 rearrangements per individual V(H) in C57BL6/J mice. We measured the fraction of rearrangements that were in-frame in B cell DNA. We demonstrate that individual V(H)s have different fractions of in-frame rearrangements (IF fractions) ranging from 10 to 90% and that these IF fractions are reproducible in different mice. For most V(H)s, the IF fraction in pro-B cells approximated 33% and then shifted to the nearly final (mature) B cell value by the cycling pre-B cell stage. The frequency of high in-frame (IF) V(H) usage increased in cycling pre-B cells compared with that in pro-B cells, whereas this did not occur for low IF V(H)s. The IF fraction did not shift as much in BCR-expressing B cells and was minimally affected by L chain usage for most V(H). High IF clan II/III V(H)s share more positively charged CDR2 sequences, whereas high IF clan I J558 CDR2 sequences are diverse. These data indicate that individual V(H)s are subjected to differential selection, that V(H) IF fraction is mainly established through pre-BCR-mediated selection, that it may operate differently in clan I versus II/III V(H)s, and that it has a lasting influence on the Ab repertoire.


Figures

Figure 1
Figure 1. Measurement and theories of the VH IF fraction
A. Schematic of spectratyping PCR. Shown is a simplified H chain locus with two VHs (J606.1 and 7183.4), two DHs, two JH gene segments and one CH. The primers (arrows) specifically amplify rearrangements that involve the J606.1 VH, either DH and JH2. The reverse primer in JH2 has a fluorescent tag (star) that is used to analyze product sizes by capillary electrophoresis. Boxes denote exons, lines represent introns, and dashed lines show which gene segments participated in a VHJ606.1-DH-JH2 rearrangement. B. Spectratypes of VHJ606.1 - JH2 rearrangements. Spleen DNA from 3-month-old B6 mice was amplified using a VH-specific J606.1 primer and a FAM-labeled JH2 primer. PCR products from five individual reactions are displayed as spectratypes. In each spectratype, the y-axis represents the fluorescence intensity and x-axis gives the product sizes in nucleotides (nt). Out of frame peaks (OF) are marked with asterisks. C. Calculation of the VH IF fraction. The in-frame (IF) fraction of a single VH amongst a population of B cells can be envisioned as a ratio of the number of productive (VHDJH+) rearrangements to the total number of productive and non-productive rearrangements (VHDJH+ + VHDJH) of that particular VH in a population of B cells. B cells expressing a given VH can have one of two genotypes, VHDJH+/DJH or VHDJH+/VHDJH. D. Model of VH IF fraction under conditions of uniform selection. According to a simplified model of H chain gene rearrangement, B cells undergo a maximum of two rearrangement attempts per cell and rearrangement promptly ceases once a productive rearrangement has occurred (27). With estimated B cell genotype frequencies of 0.6 for VDJ+/DJ and 0.4 for VDJ+/VDJ-, the overall IF fraction (VDJ+/(VDJ+ + VDJ), according to this model, is (0.6 + 0.4)/(0.6 + 0.4 + 0.4) = 0.71. E. Model of VH IF fraction under conditions of differential VH selection. Under conditions of differential VH selection, VHs will have different IF fractions. According to this model, if a VH has a high IF fraction, then B cells that express a functional H chain rearrangement (green cells) will be more frequent than B cells that harbor the same H chain as a nonfunctional rearrangement (red cells). The converse occurs if a VH has a low IF fraction.
Figure 2
Figure 2. VHs differ in their IF fractions
A. Mouse-to-mouse reproducibility of the VH IF fraction. VHIF fraction analysis was performed on spleen DNA from 3-month-old B6 mice (n=2) for VH J606.1 (white bars) and 3609N.2 (grey bars). The numbers of J606.1- JH2 rearrangements and their corresponding IF fractions (the latter in percent) were: mouse #1, 124 peaks, 80%; mouse #2, 194 peaks, 81%. For 3609N.2-JH2: mouse #1, 290 peaks, 36%; mouse #2, 293 peaks, 33%. The IF fractions calculated for individual mice are plotted for each VH. The difference in the average IF fraction between the two VHs is significant (p≪1 x 10¹⁰ by cumulative binomial probability). B. Survey of the IF fraction in 20 different VHs. VH IF fractions were measured in genomic DNA from 3-month-old B6 mice spleen DNA (n=2). VH IF fractions are arranged in the order of their location in the germline locus, with 5’ VHs on the left. The numbers of rearrangements and the IF fractions analyzed for each VH are given in the Materials and Methods section. Some of the primers bind to more than one VH (see Supplemental Table 1 for primer information).
Figure 3
Figure 3. Establishment of the VH IF fraction occurs early during B cell development
A. VH IF analysis in bone marrow pro-B (Fr. B-C) and cycling pre-B (Fr. C’) cells. IF fractions (given in percent) for J606.1-JH2, VH10-JH2, J558.47-JH2, 3609N.2-JH2 and 7183.2-JH2 rearrangements are plotted for each B cell subset. White bars denote Fr. B-C and gray bars represent Fr. C’. Asterisks denote IF fractions that differ significantly between Fr. B-C and Fr. C’ (p<0.05 by Binomial probability). B. VH peak number analysis in Fr. B-C and Fr. C’. Plotted are the frequencies of VHJ606.1-JH2, J558.85-JH2, 3609N.2-JH2, J558.47-JH2 and 7183.2-JH2 rearrangements per 10,000 sorted B cells from Fr. B-C versus Fr. C’. The total raw peak numbers are given in the Materials and Methods section. Asterisks denote peak numbers that differ significantly between Fr. B-C and C’ (p<0.05 by Chi square test). Data for both panels in the figure are pooled from sorted cells of 3-month-old B6 (n=4–8 mice).
Figure 4
Figure 4. Minimal changes in the VH IF fraction in BCR-expressing B cells
A. VH IF analysis in B cell subsets in bone marrow and spleen. IF fractions (given in percent) for J606.1-JH2, 3609N.2-JH2 and VH10-JH2 rearrangements are plotted for each B cell subset. The same data for Fr. B-C and C’ from Fig. 3A are re-plotted here for comparison. The numbers of rearrangements and the IF fractions analyzed for each subset and each VH are given in Materials and Methods. Asterisks denote IF fractions that differ significantly between the indicated subsets (p<0.05 by Binomial probability). B. The VH IF fraction is not significantly altered by light chain usage for most VHs. The VH IF fraction is compared among splenocytes (mostly κ+, filled circles, same data as in Fig. 2B), λ+ B cells (open squares, n=2 mice) and Vκ8+ splenocytes (open triangles, n= 2 mice). The IF fractions (percentages) of different VH-JH2 rearrangements are plotted in order of increasing VH IF fraction, based upon the unsorted splenocyte data. Only VH10-JH2 rearrangements display a statistically significant difference in the IF fraction in the different light chain expressing populations (black arrow, p<0.05 by the Mann-Whitney test). The numbers of rearrangements and their IF fractions are given in Materials and Methods.
Figure 5
Figure 5. Modeling of charged motifs in clan II/III VH CDR2
A. Isoelectric point (pI) analysis of the CDR2 in high versus low IF clan II/III VHs. Plotted is the mean CDR2 pI +/− standard deviation for each VH group. Each dot corresponds to a single VH sequence. Only the non-conserved 5’ portion of the CDR2 sequence is used for this analysis (see boxed regions in Fig. 5B). The high IF group is defined as having an IF fraction of greater than or equal to 50% and low IF is less than 50%. The difference between the high IF vs. low IF clan II/II CDR2 median pI is significant (p<0.01 by Mann-Whitney test). B. Alignment of high IF vs. low IF germline VH amino acid sequences. The amino acid sequences are based on the germline sequences for B6 (from (43)). The CDR2 is indicated by a horizontal line and the consensus sequence is given on top of each alignment. The motifs used for isoelectric point analysis are enclosed in boxes.

Similar articles

Cited by

References

    1. Tonegawa S. Somatic generation of antibody diversity. Nature. 1983;302:575–581. - PubMed
    1. Sakano H, Kurosawa Y, Weigert M, Tonegawa S. Identification and nucleotide sequence of a diversity DNA segment (D) of immunoglobulin heavy-chain genes. Nature. 1981;290:562–565. - PubMed
    1. Wardemann H, Yurasov S, Schaefer A, Young JW, Meffre E, Nussenzweig MC. Predominant autoantibody production by early human B cell precursors. Science. 2003;301:1374–1377. - PubMed
    1. Nemazee D. Receptor editing in lymphocyte development and central tolerance. Nat Rev Immunol. 2006;6:728–740. - PubMed
    1. Melchers F. The pre-B-cell receptor: selector of fitting immunoglobulin heavy chains for the B-cell repertoire. Nat Rev Immunol. 2005;5:578–584. - PubMed

Publication types

MeSH terms