

Structure-function relationship in glaucoma using spectral-domain optical coherence tomography
- PMID: 21746976
- PMCID: PMC3855237
- DOI: 10.1001/archophthalmol.2011.145
Structure-function relationship in glaucoma using spectral-domain optical coherence tomography
Abstract
Objectives: To determine the structure-function relationship in glaucoma using spectral-domain optical coherence tomography (SDOCT)-derived structural measurements and to evaluate this relationship using a linear model.
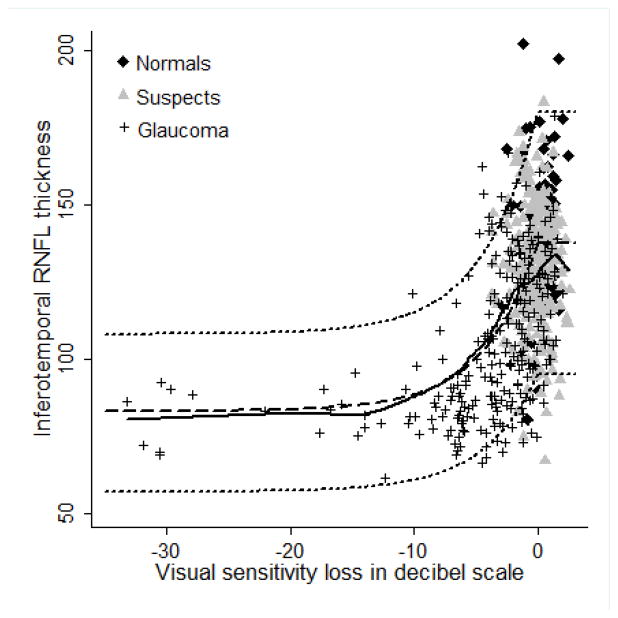
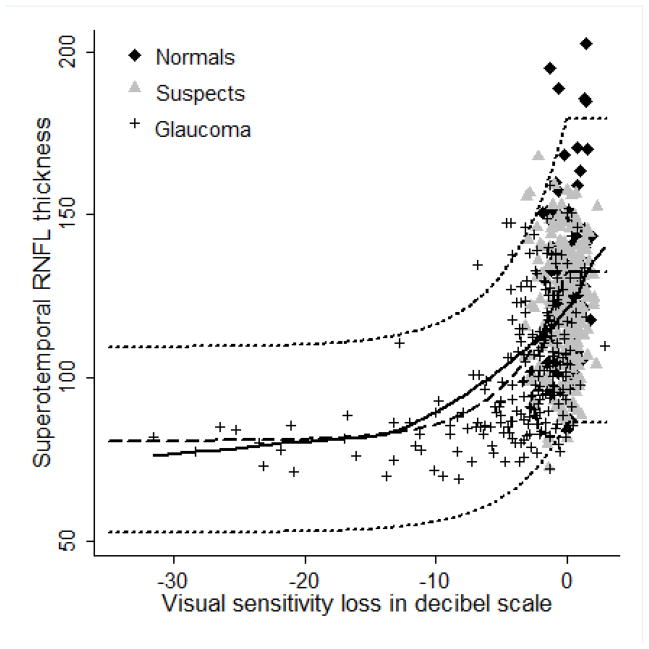
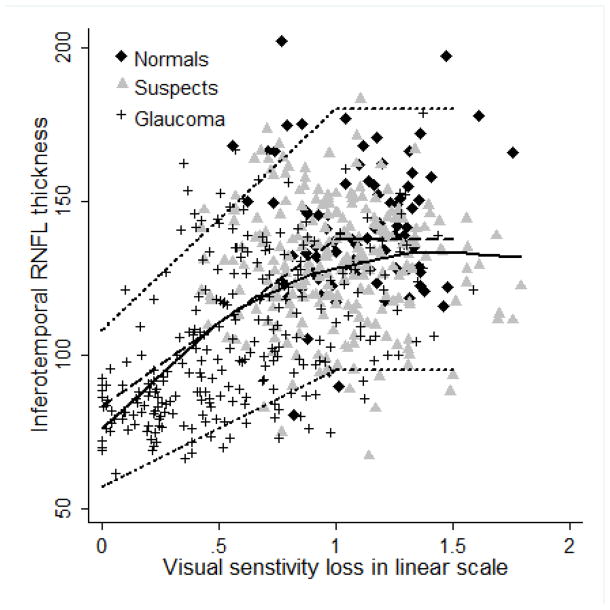
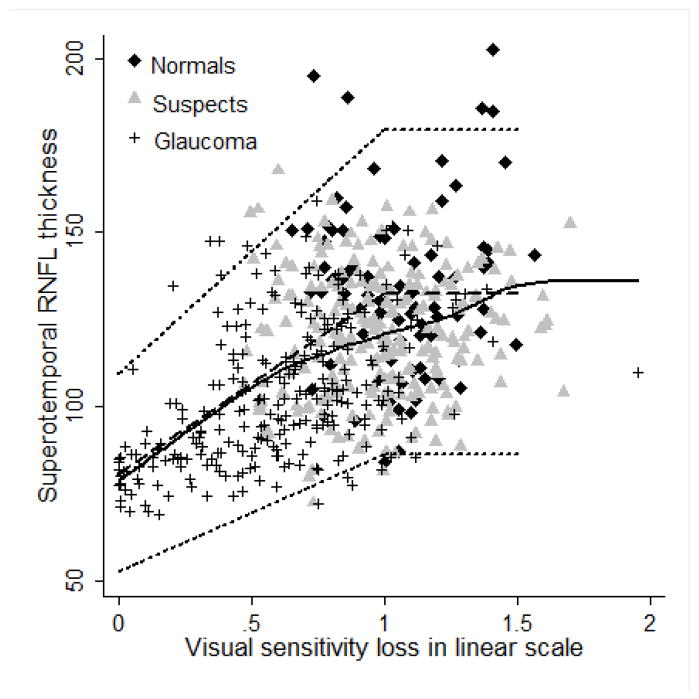
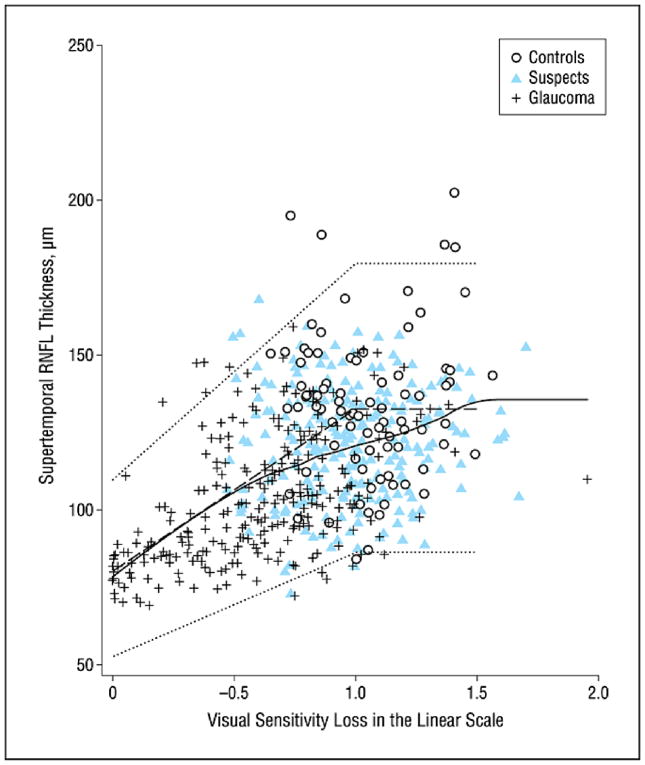
Methods: In a cross-sectional study, structure-function relationships were determined for all the participants in the DIGS (Diagnostic Innovations in Glaucoma Study) and the ADAGES (African Descent and Glaucoma Evaluation Study) who had undergone standard automated perimetry (SAP) and SDOCT within 6 months of each other. Strength of relationship was reported as coefficient of determination (R(2)). The relationship was also evaluated using a previously described linear model.
Results: The results of 579 SAP and SDOCT examinations from 80 eyes of 47 control subjects, 199 eyes of 130 patients with suspected glaucoma, and 213 eyes of 146 patients with glaucoma were analyzed. The R(2) for the association between SAP total deviation and SDOCT variables ranged from 0.01 (P = .02) for the nasal rim area to 0.30 (P < .001) for inferior inner retinal thickness at the macula. The linear model fitted the data well.
Conclusions: The strongest structure-function associations using SDOCT were found for retinal nerve fiber layer measurements at arcuate areas and inner retinal thickness at the macula measurements. The linear model is useful in studying the structure-function relationship in glaucoma.
Figures
References
-
- Garway-Heath DF, Holder GE, Fitzke FW, Hitchings RA. Relationship between electrophysiological, psychophysical, and anatomical measurements in glaucoma. Invest Ophthalmol Vis Sci. 2002 Jul;43(7):2213–2220. - PubMed
-
- Bowd C, Zangwill LM, Medeiros FA, et al. Structure-function relationships using confocal scanning laser ophthalmoscopy, optical coherence tomography, and scanning laser polarimetry. Invest Ophthalmol Vis Sci. 2006 Jul;47(7):2889–2895. - PubMed
-
- El Beltagi TA, Bowd C, Boden C, et al. Retinal nerve fiber layer thickness measured with optical coherence tomography is related to visual function in glaucomatous eyes. Ophthalmology. 2003 Nov;110(11):2185–2191. - PubMed
-
- Miglior S, Riva I, Guareschi M, et al. Retinal sensitivity and retinal nerve fiber layer thickness measured by optical coherence tomography in glaucoma. Am J Ophthalmol. 2007 Nov;144(5):733–740. - PubMed
Publication types
MeSH terms
Grants and funding
LinkOut - more resources
Full Text Sources
Medical
Miscellaneous
