. 2011 Jul 26;124(4):465-76.
doi: 10.1161/CIRCULATIONAHA.110.008698. Epub 2011 Jul 11.

Nitric oxide scavenging by red blood cell microparticles and cell-free hemoglobin as a mechanism for the red cell storage lesion

Affiliations

Nitric oxide scavenging by red blood cell microparticles and cell-free hemoglobin as a mechanism for the red cell storage lesion

Chenell Donadee et al. Circulation. .

Abstract

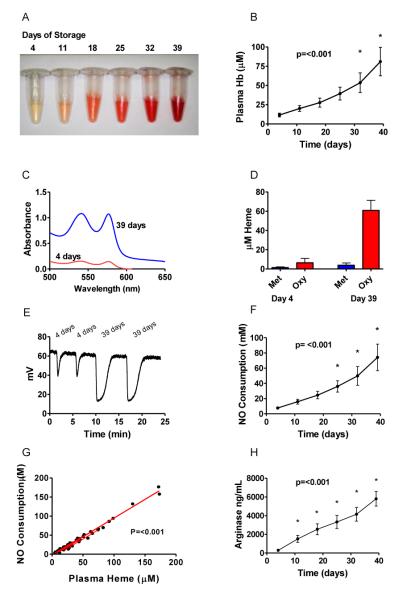
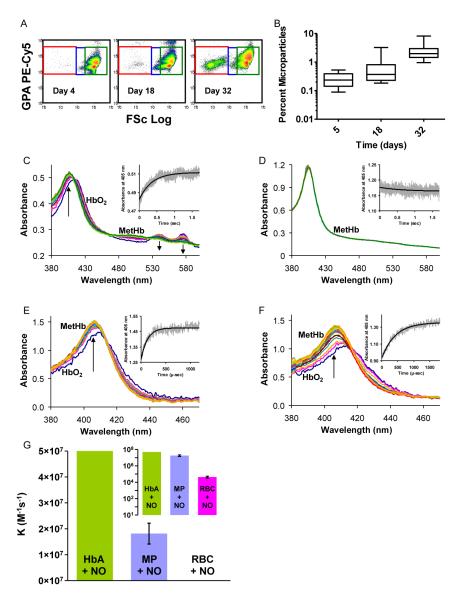
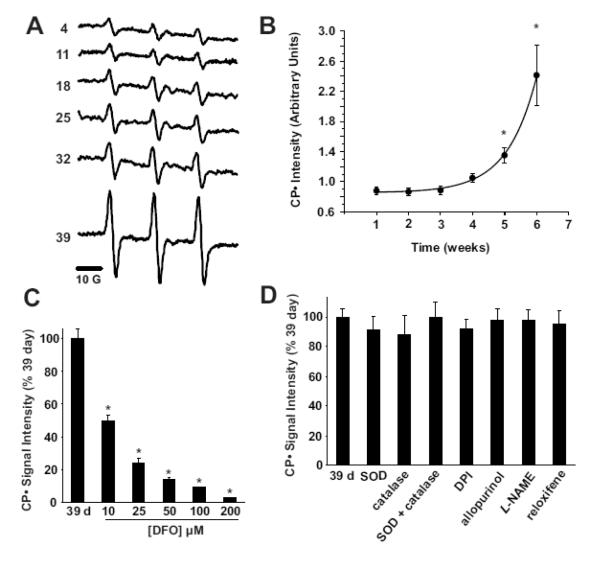
Background: Intravascular red cell hemolysis impairs nitric oxide (NO)-redox homeostasis, producing endothelial dysfunction, platelet activation, and vasculopathy. Red blood cell storage under standard conditions results in reduced integrity of the erythrocyte membrane, with formation of exocytic microvesicles or microparticles and hemolysis, which we hypothesized could impair vascular function and contribute to the putative storage lesion of banked blood.

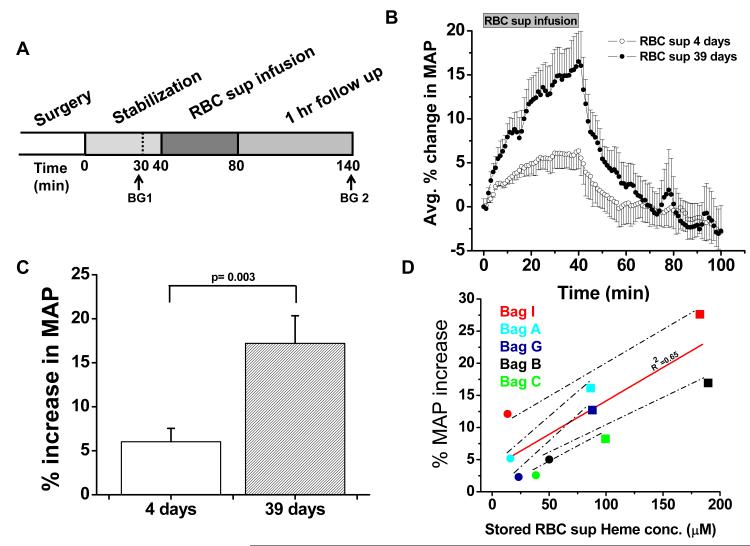
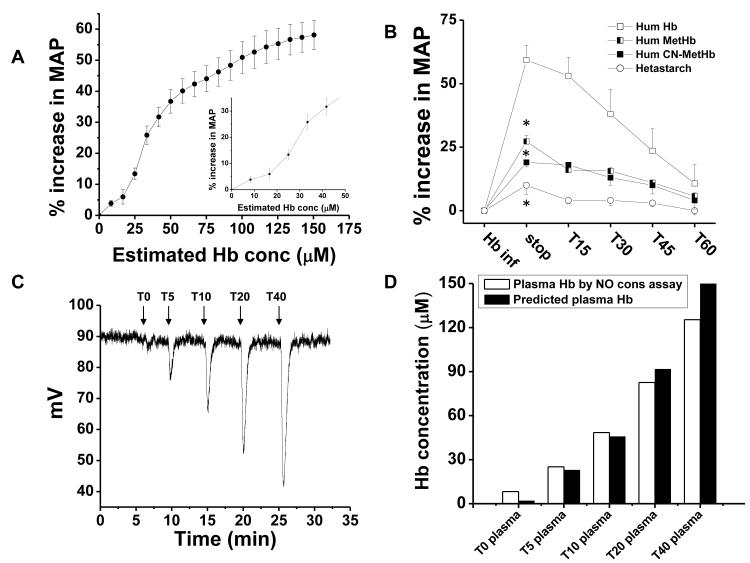
Methods and results: We now find that storage of human red blood cells under standard blood banking conditions results in the accumulation of cell-free and microparticle-encapsulated hemoglobin, which, despite 39 days of storage, remains in the reduced ferrous oxyhemoglobin redox state and stoichiometrically reacts with and scavenges the vasodilator NO. Using stopped-flow spectroscopy and laser-triggered NO release from a caged NO compound, we found that both free hemoglobin and microparticles react with NO about 1000 times faster than with intact erythrocytes. In complementary in vivo studies, we show that hemoglobin, even at concentrations below 10 μmol/L (in heme), produces potent vasoconstriction when infused into the rat circulation, whereas controlled infusions of methemoglobin and cyanomethemoglobin, which do not consume NO, have substantially reduced vasoconstrictor effects. Infusion of the plasma from stored human red blood cell units into the rat circulation produces significant vasoconstriction related to the magnitude of storage-related hemolysis.

Conclusions: The results of these studies suggest new mechanisms for endothelial injury and impaired vascular function associated with the most fundamental of storage lesions, hemolysis.


Figures

Figure 1
Figure 1. Cell Free hemoglobin and NO scavenging in stored blood
(A) Photograph of stored red blood cell supernatant over time. (B) Average cell free plasma heme concentration (μM) over time. (C) Absorbance spectra of representative packed red blood cell supernatants at 4 and 39 days of storage. (D) Concentration (μM) of methemoglobin and oxyhemoglobin by spectral deconvolution of packed red blood cell supernatant. (E) Raw data for NO consumption assay. (F) NO Consumption over Time. (G) Nitric oxide consumption is directly proportional to the plasma heme concentration. (H) Arginase-1 levels increasing over time. Overall P values show are for the significance of the change over time analyzed by RM-ANOVA. For panels (B) and (F) and (H) an * represents a statistically significant difference of time points compared 4 days of storage by Bonferroni correction after RM-ANOVA.
Figure 2
Figure 2. Microparticle formation and NO scavenging in stored blood
(A) The flow cytometry histograms show forward light scatter (FSc Log) versus fluorescence intensity of labeled glycophorin A PE-Cy5. Intact red blood cells have relatively high forward light scatter (green box). As they transition (blue box) to microparticles (MP) (red box) forward light scatter and GPA fluorescence intensity decrease. A small proportion of MPs are evident after short storage (4 days), but they increase significantly over time (B). Microparticle median values were 0.24, 0.37, and 1.99% at days 4, 18 and 32 of storage, respectively. (C) A reaction between 0.05 mM red cell-encapsulated oxyhemoglobin and 0.1 mM NO measured by stopped-flow. The arrows point in the direction of changing absorbance at the methemoglobin peak of 405 nm and at the oxyhemoglobin peaks of 541 and 577 nm. The inset shows absorbance at 405 nm. (D) A reaction between 0.05 mM microparticle-encapsulated oxyhemoglobin and 0.05 mM NO as measured by stopped-flow is too fast to be observed. (E) A reaction of 0.02 mM cell-free oxyhemoglobin with NO in a photolysis experiment. The inset shows absorbance at 405 nm. (F) A reaction of 0.02 mM microparticle-encapsulated oxyhemoglobin with NO in a photolysis experiment. The caged NO solution used is the same as that in the experiment of panel E. (G) The measured bimolecular rate constants for the dioxygention of NO by microparticle- and red blood cell-encapsulated oxyhemoglobin compared with the rate for cell-free oxyhemoglobin. The inset displays these data on a logarithmic scale.
Figure 3
Figure 3. Storage of packed red blood cells induces time-dependent, iron-mediated radical formation
(A) Representative EPR spectra of CPH exposed to packed red blood cell supernatants for 10 min at 37°C. Spectra represent a signal average of 5 scans from t=9 to t=10 min. (B) The mean CP• signal intensity is displayed versus time (weeks) of storage (n=3), * indicates statistically significant from week 1 by Bonferroni correction of RM-ANOVA, P<0.05. (C) Supernatants from 39 day old packed red blood cells were exposed to 50 μM CPH in the presence of increasing concentrations (10-200 μM) of deferoxamine, * indicates statistically significant from day 39 by Bonferroni correction of RM-ANOVA, P < 0.05. (D) Supernatants from 39 day old packed red blood cells were exposed to 50 μM CPH in the presence of SOD (100 U/mL), catalase (100 U/mL), SOD + catalase, diphenyleneiodonium (DPI) (100 μM), allopurinol (100μM), L-NAME (100 μM) and reloxifene (100 μM). Data represent mean ± SEM of at least three independent determinations and were not statistically significant.
Figure 4
Figure 4. Vasoactivity of infused packed red cell supernatant/plasma
(A) Experimental time line for packed red cell supernatant infusions. Rats were stabilized for 30 minutes after surgery and blood gasses were drawn as indicated (BG 1 and 2). Supernatant (1.6 mL) of packed red blood cells stored either for 4 or 39 days was infused for 40 min, after which the rats were followed up for 1 hour (n=5). (B) Change in MAP over time after packed red blood cell supernatant infusion and 60 minute follow up. (C) Average percentage peak increase in MAP after infusion of packed red blood cell supernatants (P < 0.003). (D) Correlation (solid line) between the PRBC supernatant heme concentration and the percentage increase in MAP after a 40 minute infusion of either 4 days (●) or 39 days (■) stored PRBC supernatant (r2 = 0.65). Each data point was obtained from a separate rat infusion experiment, in a different rat (2 groups of n=5). All values are displayed as mean ± SEM. A Student’s t test was used to compare the two groups of rats.
Figure 5
Figure 5. Low concentrations of ferrous oxyhemoglobin increase MAP in rats
(A) Percentage increase in MAP after infusion of human hemoglobin (175 mg/kg) as a function of estimated rat plasma hemoglobin concentration (expressed as heme) as calculated from the dilution of infused hemoglobin in rat plasma volume over the 10-min infusion time. The inset shows a magnification of the data for a plasma hemoglobin concentration between 0 to 60 μM. (B) Percentage increase in MAP after infusion of unmodified human hemoglobin (□) and after modification of human hemoglobin to methemoglobin (◧) or cyanomethemoglobin (■) compared to infusion of the plasma expander hetastarch (엯). An * indicates a result that is significantly different (P <0.05) from hemoglobin by ANOVA. Methemoglobin vs cyanomethemoglobin was not statistically significant from each other by ANOVA. (C) Rat plasma samples obtained before (T0), and after 5, 10, 20 and 40 min (T5-40) of infusion of human hemoglobin and then were analysed by tri-iodide chemiluminescence for NO consumption. (D) The area under the peaks (NO consumption) was quantified (open bars) and compared with the levels of cell free plasma hemoglobin.

Comment in

Similar articles

Cited by

References

    1. The 2007 National Blood Collection and Utilization Survey Report. US Dept of Health and Human Services; Washington DC: 2009.
    1. Vincent JL, Baron JF, Reinhart K, Gattinoni L, Thijs L, Webb A, Meier-Hellmann A, Nollet G, Peres-Bota D. Anemia and blood transfusion in critically ill patients. JAMA. 2002;288:1499–507. - PubMed
    1. Napolitano LM, Kurek S, Luchette FA, Corwin HL, Barie PS, Tisherman SA, Hebert PC, Anderson GL, Bard MR, Bromberg W, Chiu WC, Cipolle MD, Clancy KD, Diebel L, Hoff WS, Hughes KM, Munshi I, Nayduch D, Sandhu R, Yelon JA. Clinical practice guideline: red blood cell transfusion in adult trauma and critical care. Crit Care Med. 2009;37:3124–57. - PubMed
    1. Corwin HL, Gettinger A, Pearl RG, Fink MP, Levy MM, Abraham E, MacIntyre NR, Shabot MM, Duh MS, Shapiro MJ. The CRIT Study: Anemia and blood transfusion in the critically ill--current clinical practice in the United States. Crit Care Med. 2004;32:39–52. - PubMed
    1. Collins JA, James PM, Bredenberg CE, Anderson RW, Heisterkamp CA, Simmons RL. The relationship between transfusion and hypoxemia in combat casualties. Ann Surg. 1978;188:513–20. - PMC - PubMed

Publication types