. 2011 Jul 26;124(4):444-53.
doi: 10.1161/CIRCULATIONAHA.110.014506. Epub 2011 Jul 11.

Altered mitochondrial dynamics contributes to endothelial dysfunction in diabetes mellitus

Affiliations

Altered mitochondrial dynamics contributes to endothelial dysfunction in diabetes mellitus

Sherene M Shenouda et al. Circulation. .

Abstract

Background: Endothelial dysfunction contributes to the development of atherosclerosis in patients with diabetes mellitus, but the mechanisms of endothelial dysfunction in this setting are incompletely understood. Recent studies have shown altered mitochondrial dynamics in diabetes mellitus with increased mitochondrial fission and production of reactive oxygen species. We investigated the contribution of altered dynamics to endothelial dysfunction in diabetes mellitus.

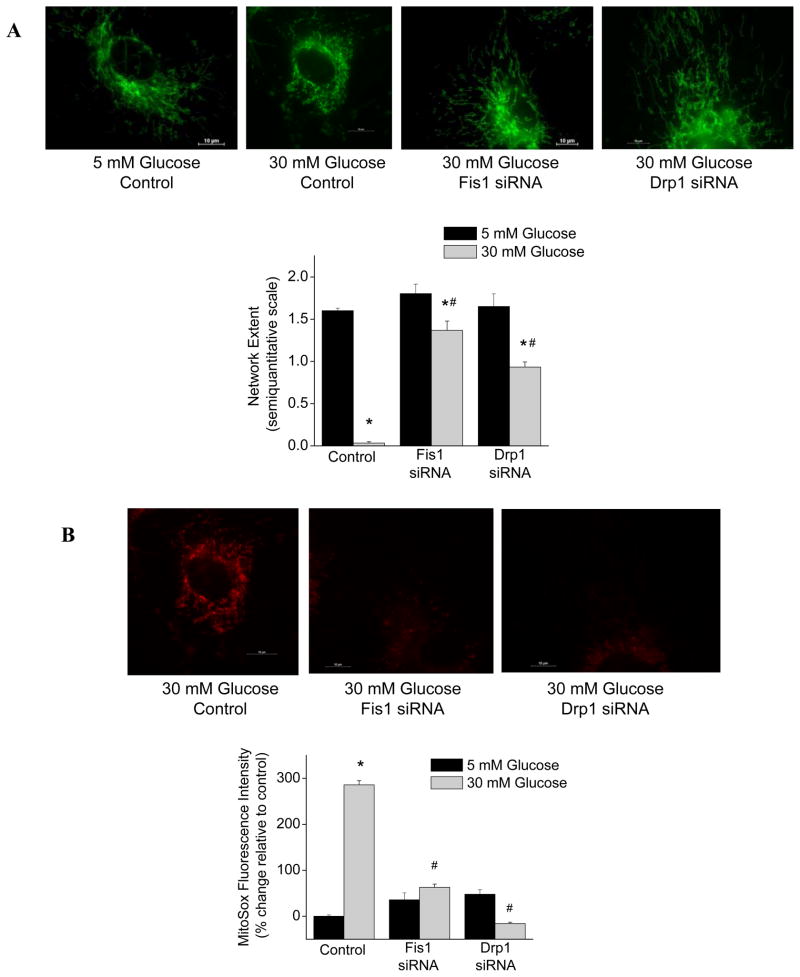
Methods and results: We observed mitochondrial fragmentation (P=0.002) and increased expression of fission-1 protein (Fis1; P<0.0001) in venous endothelial cells freshly isolated from patients with diabetes mellitus (n=10) compared with healthy control subjects (n=9). In cultured human aortic endothelial cells exposed to 30 mmol/L glucose, we observed a similar loss of mitochondrial networks and increased expression of Fis1 and dynamin-related protein-1 (Drp1), proteins required for mitochondrial fission. Altered mitochondrial dynamics was associated with increased mitochondrial reactive oxygen species production and a marked impairment of agonist-stimulated activation of endothelial nitric oxide synthase and cGMP production. Silencing Fis1 or Drp1 expression with siRNA blunted high glucose-induced alterations in mitochondrial networks, reactive oxygen species production, endothelial nitric oxide synthase activation, and cGMP production. An intracellular reactive oxygen species scavenger provided no additional benefit, suggesting that increased mitochondrial fission may impair endothelial function via increased reactive oxygen species.

Conclusion: These findings implicate increased mitochondrial fission as a contributing mechanism for endothelial dysfunction in diabetic states.


Figures

Figure 1
Figure 1
Diabetes mellitus is associated with increased mitochondrial fission in endothelial cells. Venous endothelial cells were collected from healthy volunteers (n=9) and patients with diabetes mellitus (n=10) as described in Methods. A: Mitochondria were labeled in live endothelial cells with Mitotracker Green FM (Invitrogen) and images were captured at 100X. A representative endothelial cell from a healthy control (left) shows a complex network of threadlike mitochondria, while a representative cell from a diabetic patient (right) shows smaller, punctate mitochondria. Fixed cells were stained for cytochrome c and mitochondrial network extent was rated in a blinded manner using a semi-quantitative scale. Network extent was lower in the diabetics (*P=0.002). B: Freshly isolated human venous endothelial cells were fixed and stained for Fis1 protein expression. A representative cell from a diabetic patient (right) shows markedly higher Fis1 expression compared to a cell from a healthy control (left). Pooled data show that Fis1 levels were significantly higher in the diabetics (n=6 per group, *P<0.0001).
Figure 2
Figure 2
High glucose concentration induces mitochondrial fission in endothelial cells. As described in Methods, human aortic endothelial cells were incubated with 5 mM, 30 mM glucose, or 5 mM glucose + 25 mM mannitol (as an osmotic control) for 24 hours. A. To assess network extent, cells were fixed at the indicated time points, stained for cytochrome c, and rated on a semi-quantitative scale. Left panel: High glucose was associated with a rapid and sustained loss of mitochondrial networks (interaction P<0.001 by repeated measures ANOVA). Right panel: Mannitol had no effect on network extent, arguing against an osmotic effect. B. Gene expression was assessed by quantitative real time PCR after 24 hours of glucose incubation, and there were significant increases in Fis1 and Mfn2. C. Protein expression was measured by Western blot analysis after 24 hours of glucose incubation. Expression of Fis1 and Drp1 increased significantly. There was no significant change in Mfn2 or Opa1. AU = arbitrary units. Data are shown as mean ± SEM for 3 experiments (*P<0.05 versus 5 mM glucose).
Figure 3
Figure 3
High glucose concentration induces mitochondrial ROS production. As described in Methods, HAEC’s were incubated with 5 mM or 30 mM glucose for 24 hours. Mitochondrial ROS production was assessed using 5 μM Mitosox (red fluorescence) and mitochondria were localized using 100 nM Mitotracker Green (green fluorescence). A. Representative fluorescence images showing increased ROS production that co-localizes with mitochondria in endothelial cells incubated with high glucose. High glucose is also associated with mitochondrial fragmentation. B. Pooled data showing that ROS production is higher in cells exposed to 30 mM glucose. Data are shown as mean ± SEM for 3 experiments (*P=0.01 versus 5 mM glucose).
Figure 4
Figure 4
Elevated glucose level impairs eNOS activation. HAEC’s were incubated with 5 mM or 30 mM glucose for 24 hours and eNOS activation was evaluated as eNOS phosphorylation in response to acetylcholine (A), insulin (B), or A23187 (C), as described in Methods. As shown, 30 mM glucose blunted the eNOS phosphorylation to each agonist (interaction P<0.001 by ANOVA). Data are mean ± SEM for 3 experiments. D. Production of bioactive nitric oxide was assessed as the relative increase in cGMP in response to A23187. As shown, 30 mM glucose blunted cGMP production (interaction P<0.001 by ANOVA; *P<0.01 versus control and versus 30 mM glucose by SNK pairwise comparison). Data are mean ± SEM for 12 experiments.
Figure 5
Figure 5
siRNA transfection effectively reduces expression of Fis1 and Drp1. HAEC’s were transfected with Fis1 or Drp1 siRNA for 48 hours as described in Methods. siRNA transfection reduced message (A and B) and protein (C and D) in HAEC’s exposed to 5 mM or 30 mM glucose (interaction P<0.01 by ANOVA; *P<0.05 for 5 mM versus 30 mM glucose and #P<0.05 for siRNA versus control by SNK pairwise comparison). Data are mean ± SEM for 3 experiments
Figure 6
Figure 6
Silencing Fis1 or Drp1 expression prevents glucose-induced loss of mitochondrial networks and glucose-induced ROS production. A. Mitochondria were imaged in HAEC’s with Mitotracker Green and representative images show that silencing either fission protein maintained mitochondrial networks under high glucose conditions. Pooled data show a protective effect on network extent (interaction P<0.001 by ANOVA). B. Mitochondrial ROS production was imaged in HAEC’s with Mitosox and representative images show that silencing either fission protein produces a marked decrease in ROS production. Pooled data confirm that Fis1 and Drp1 siRNA prevent glucose-induced increases in ROS (interaction P<0.001 by ANOVA; *P<0.001 versus 5 mM glucose and #P<0.01 versus control by SNK pairwise comparison). Data are mean ± SEM for 3 experiments.
Figure 7
Figure 7
Silencing Fis1 or Drp1 expression prevents glucose-induced impairment of eNOS activation. As described in Methods, eNOS phosphorylation was measured after 5 minute exposure to acetylcholine (A), insulin (B), or A23187 (C) in the presence of 5 or 30 mM (high) glucose. Silencing either fission protein restored the eNOS phosphorylation response to each agonist with 30 mM glucose (interaction P<0.001 by ANOVA; *P<0.01 compared to control by SNK pairwise comparison). Addition of tiron (5mM) also restored the response to A23187 with 30 mM glucose, and the combination of siRNA and tiron had no additional effect. Data are shown as mean ± SEM for 3 experiments.
Figure 8
Figure 8
Silencing Fis1 expression or scavenging ROS prevents glucose-induced impairment of cGMP production. As described in Methods, cGMP was measured after 5 minute exposure to A23187 in the presence of 5 or 30 mM glucose. Silencing Fis1 expression or addition of tiron (5mM) prevented endothelial dysfunction in the setting of high glucose (interaction P<0.001 by ANOVA; *P<0.01 compared to control and #P<0.05 compared to Fis1 siRNA, tiron, and siRNA + tiron by SNK pairwise comparison). The combination of Fis1 siRNA and tiron produced no additional effect compared to Fis1 siRNA alone. Data are shown as mean ± SEM for 9 to 12 experiments.

Similar articles

Cited by

References

    1. Center for Disease Control and Prevention. 2007 National Diabetes Fact Sheet. 2007.
    1. Tabit CE, Chung WB, Hamburg NM, Vita JA. Endothelial dysfunction in diabetes mellitus: molecular mechanisms and clinical implications. Rev Endocr Metab Disord. 2010;11:61–74. - PMC - PubMed
    1. Cohen RA, Tong X. Vascular oxidative stress: the common link in hypertensive and diabetic vascular disease. J Cardiovasc Pharmacol. 2010;55:308–316. - PMC - PubMed
    1. Tesfamariam B, Cohen RA. Free radicals mediate endothelial cell dysfunction caused by elevated glucose. Am J Physiol. 1992;263:H321–H326. - PubMed
    1. Inoguchi T, Li P, Umeda F, Yu HY, Kakimoto M, Imamura M, Aoki T, Etoh T, Hashimoto T, Naruse M, Sano H, Utsumi H, Nawata H. High glucose level and free fatty acid stimulate reactive oxygen species production through protein kinase C--dependent activation of NAD(P)H oxidase in cultured vascular cells. Diabetes. 2000;49:1939–1945. - PubMed

Publication types

MeSH terms