. 2011 Aug;121(8):3343-56.
doi: 10.1172/JCI44957. Epub 2011 Jul 11.

Increases in p53 expression induce CTGF synthesis by mouse and human hepatocytes and result in liver fibrosis in mice

Affiliations

Increases in p53 expression induce CTGF synthesis by mouse and human hepatocytes and result in liver fibrosis in mice

Takahiro Kodama et al. J Clin Invest. 2011 Aug.

Abstract

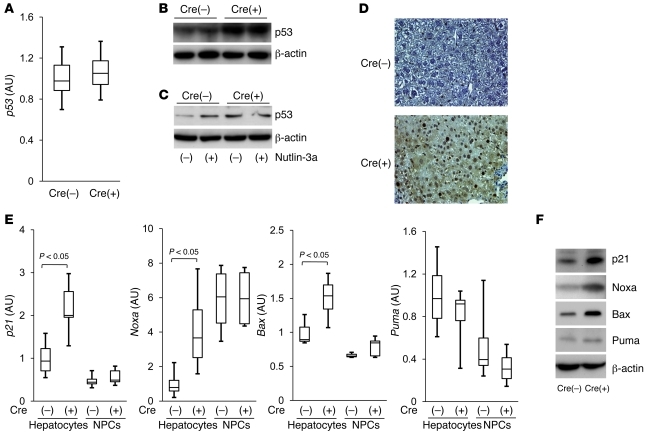
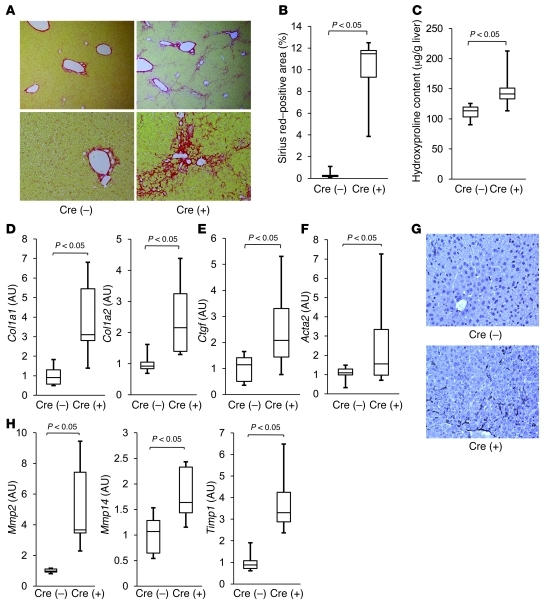
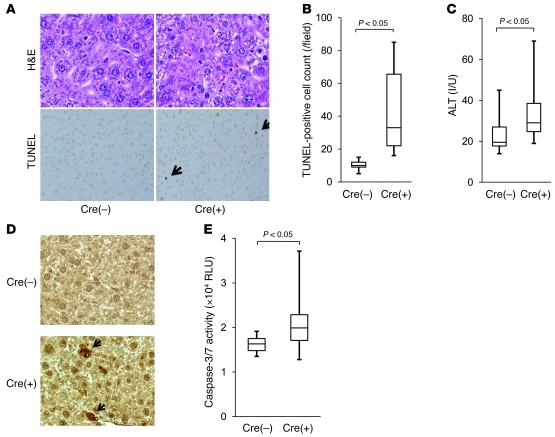
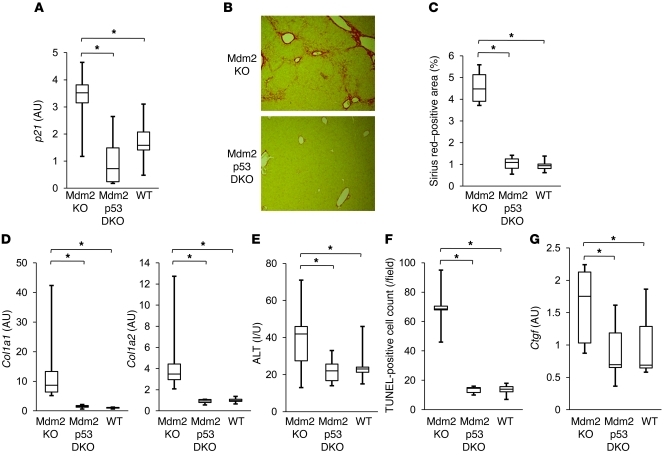
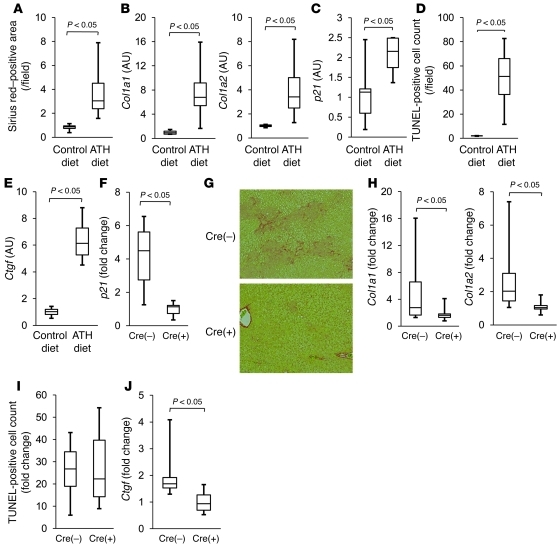
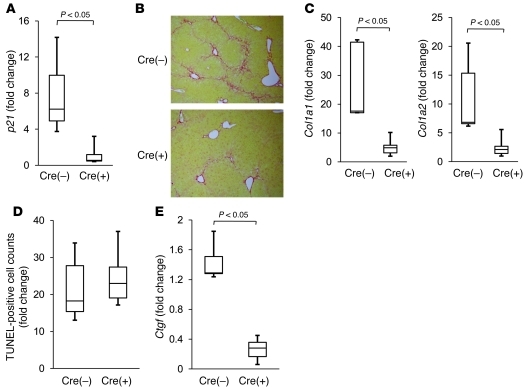
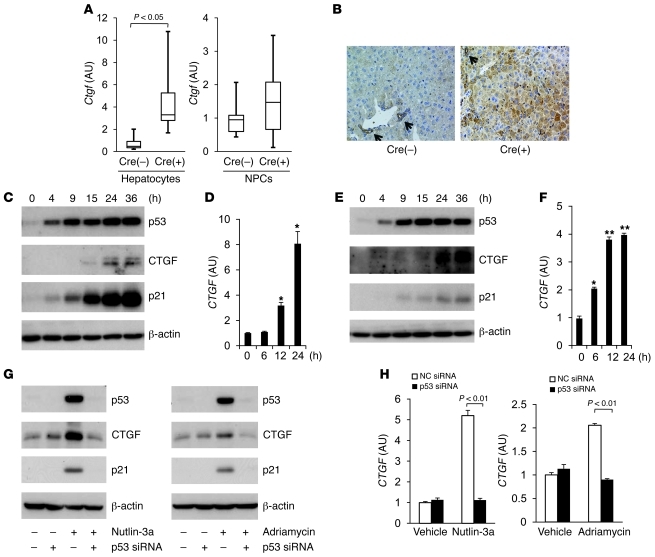
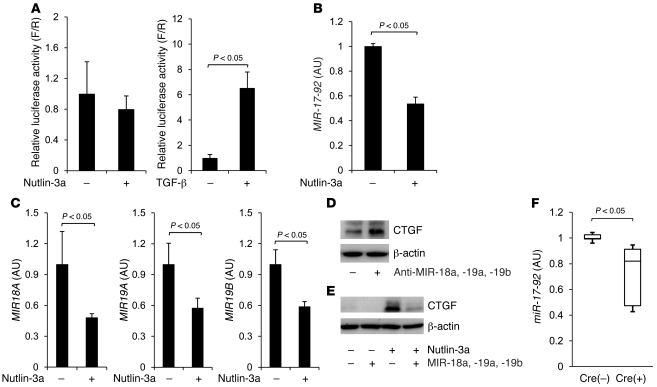
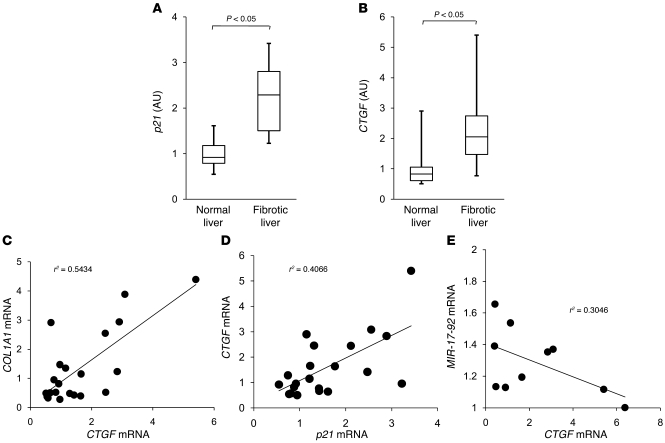
The tumor suppressor p53 has been implicated in the pathogenesis of non-cancer-related conditions such as insulin resistance, cardiac failure, and early aging. In addition, accumulation of p53 has been observed in the hepatocytes of individuals with fibrotic liver diseases, but the significance of this is not known. Herein, we have mechanistically linked p53 activation in hepatocytes to liver fibrosis. Hepatocyte-specific deletion in mice of the gene encoding Mdm2, a protein that promotes p53 degradation, led to hepatocyte synthesis of connective tissue growth factor (CTGF; the hepatic fibrogenic master switch), increased hepatocyte apoptosis, and spontaneous liver fibrosis; concurrent removal of p53 completely abolished this phenotype. Compared with wild-type controls, mice with hepatocyte-specific p53 deletion exhibited similar levels of hepatocyte apoptosis but decreased liver fibrosis and hepatic CTGF expression in two models of liver fibrosis. The clinical significance of these data was highlighted by two observations. First, p53 upregulated CTGF in a human hepatocellular carcinoma cell line by repressing miR-17-92. Second, human liver samples showed a correlation between CTGF and p53-regulated gene expression, which were both increased in fibrotic livers. This study reveals that p53 induces CTGF expression and promotes liver fibrosis, suggesting that the p53/CTGF pathway may be a therapeutic target in the treatment of liver fibrosis.


Figures

Figure 1
Figure 1. Hepatocyte-specific Mdm2-knockout mice show endogenous p53 accumulation, leading to transactivation of p53-regulated genes.
(AF) Mdm2fl/flalb-cre [Cre(+)] mice and Mdm2fl/fl [Cre(–)] mice were analyzed at 6 weeks of age. (A) p53 mRNA levels in the liver tissue were determined by real-time RT-PCR; 7 mice per group. (B) Expression of p53 protein in liver tissue was assessed by Western blot analysis. (C) Expression of p53 protein in isolated hepatocytes upon treatment with 20 μM nutlin-3a or vehicle was assessed by Western blot analysis. (D) Expression of p53 protein in the liver section was determined by immunohistochemical analysis. Original magnification, ×200. (E) p21, Noxa, Bax, and Puma mRNA levels in isolated hepatocytes and NPCs were determined by real-time RT-PCR; 4 mice per group. Expression of p21, Noxa, Bax, and Puma proteins in liver tissue was assessed by Western blot analysis (F).
Figure 2
Figure 2. Hepatocyte-specific Mdm2-knockout mice develop spontaneous liver fibrosis with an increase in expression of the Ctgf gene.
(AH) Mdm2fl/flalb-cre [Cre(+)] mice and Mdm2fl/fl [Cre(–)] mice were analyzed at 6 weeks of age; 6 mice per group. (A) Liver fibrosis was evaluated by picrosirius red staining of liver sections (original magnification, upper panels, ×100; lower panels, ×200). (B) Sirius red–positive area of liver sections. (C) Hepatic hydroxyproline content. Col1a1 and Col1a2 (D), Ctgf (E), and Acta2 (F) mRNA levels in the liver were determined by real time RT-PCR. (G) Expression of α-SMA in the liver sections was analyzed by immunohistochemistry. Original magnification, ×200. (H) Mmp2, Mmp14, and Timp1 mRNA levels in the liver were determined by real time RT-PCR.
Figure 3
Figure 3. Hepatocyte-specific Mdm2 deletion induces modest hepatocyte apoptosis.
(AE) Mdm2fl/flalb-cre [Cre(+)] mice and Mdm2fl/fl [Cre(–)] mice were examined at 6–8 weeks of age; more than 6 mice per group. (A) Hepatocyte apoptosis was evaluated by H&E staining and TUNEL staining of liver sections; black arrows indicate TUNEL-positive cells. Original magnification, upper panels, ×400; lower panels, ×200. (B) TUNEL-positive cell counts of liver sections. (C) Serum levels of ALT. (D) Expression of cleaved caspase-3 protein in the liver sections was assessed by immunohistochemistry; black arrows indicate cleaved caspase-3–positive cells. Original magnification, ×400. (E) Serum caspase-3/7 activity. RLU, relative light units.
Figure 4
Figure 4. Spontaneous liver fibrosis in hepatocyte-specific Mdm2-knockout mice is completely abolished in a hepatocyte-specific p53-knockout background.
(AG) Offspring from mating of Mdm2fl/flTrp53fl/+alb-cre mice and Mdm2fl/flTrp53fl/+ mice were analyzed at 6 weeks of age; more than 5 mice per group. Mdm2 KO, Mdm2fl/flTrp53+/+alb-cre; Mdm2 p53 DKO, Mdm2fl/fltrp53fl/flalb-cre; WT, Mdm2fl/flTrp53fl/fl or Mdm2fl/flTrp53+/+; *P < 0.05. (A) p21 mRNA levels in the liver were determined by real-time RT-PCR. (B) Liver fibrosis was evaluated by picrosirius red staining of liver sections. Original magnification, ×100. (C) Sirius red–positive area of liver sections. (D) Col1a1 and Col1a2 mRNA levels in the liver were determined by real-time RT-PCR. (E) Serum levels of ALT. (F) Hepatocyte apoptosis was evaluated by TUNEL staining of liver sections. (G) Ctgf mRNA levels in the liver were determined by real-time RT-PCR. *P < 0.05.
Figure 5
Figure 5. Hepatocyte-specific p53-knockout mice show alleviated liver fibrosis induced by ATH diet with suppression of the CTGF increase.
(AE) C57BL6/J mice were fed ATH diet or control diet for 4 weeks and then examined; 4 mice per group. (A) Liver fibrosis was evaluated by picrosirius red staining of liver sections. (B) Col1a1 and Col1a2 mRNA levels in the liver were determined by real-time RT-PCR. (C) p21 mRNA levels in the liver were determined by real-time RT-PCR. (D) Hepatocyte apoptosis was evaluated by TUNEL staining of liver sections. (E) Ctgf mRNA levels in the liver were determined by real-time RT-PCR. (FJ) Trp53fl/fl [(Cre(–)] mice and Trp53fl/flalb-cre [Cre(+)] mice were fed ATH diet or control diet for 4 weeks and then examined; more than 6 mice per group; data are presented as fold change in the ATH diet group compared with the control diet group. (F) p21 mRNA levels in the liver were determined by real-time RT-PCR. (G) Liver fibrosis was evaluated by picrosirius red staining of the liver sections. Original magnification, ×100. (H) Col1a1 and Col1a2 mRNA levels in the liver were determined by real-time RT-PCR. (I) Hepatocyte apoptosis was evaluated by TUNEL staining of liver sections. (J) Ctgf mRNA levels in the liver were determined by real-time RT-PCR.
Figure 6
Figure 6. Hepatocyte-specific p53-knockout mice show alleviated liver fibrosis induced by TAA administration, with suppression of the CTGF increase.
(AE) Trp53fl/fl [Cre(–)] mice and Trp53fl/flalb-cre [Cre(+)] mice were given intraperitoneal injection of 200 mg/kg TAA 3 times per week for 6 weeks and then analyzed; 6 mice per group; data are presented as fold change in the TAA-treated group compared with the nontreated group. (A) p21 mRNA levels in the liver were determined by real-time RT-PCR. Original magnification, ×100. (B) Liver fibrosis was evaluated by picrosirius red staining of the liver sections. (C) Col1a1 and Col1a2 mRNA levels in the liver were determined by real-time RT-PCR. (D) Hepatocyte apoptosis was evaluated by TUNEL staining of liver sections. (E) Ctgf mRNA levels in the liver were determined by real-time RT-PCR.
Figure 7
Figure 7. p53 regulates CTGF synthesis in hepatocytes.
(A) Hepatocytes and NPCs were isolated from Mdm2fl/fl [Cre(–)] mice and Mdm2fl/flalb-cre [Cre(+)] mice by collagenase-pronase perfusion of the liver. Ctgf mRNA levels in the isolated hepatocytes (left panel) and NPCs (right panel) were determined by real-time RT-PCR; 4–6 mice per group. (B) Expression of CTGF protein in liver sections was assessed by immunohistochemistry; black arrows indicate cholangiocytes. Original magnification, ×200. (C and D) HepG2 cells (1.0 × 10⁵) were treated with nutlin-3a (20 μM) or vehicle for the indicated time courses. (C) Western blot analysis of p53, CTGF, and p21 proteins. (D) Real-time RT-PCR analysis of CTGF mRNA expression; n = 3/group; *P < 0.01 versus the other 3 groups. (E and F) HepG2 cells (1.0 × 10⁵) were treated with Adriamycin (1 μM) or vehicle for indicated time courses. (E) Western blot analysis of p53, CTGF, and p21 proteins. (F) Real-time RT-PCR analysis of CTGF expression; n = 3/group; *P < 0.01 versus the other 3 groups, **P < 0.01 versus 0- and 6-hour groups. (G and H) HepG2 cells were transfected with p53 siRNA or control siRNA for 3 days and then cultured for 24 hours with nutlin-3a (20 μM), Adriamycin (1 μM), or vehicle. (G) Western blot analysis of p53, CTGF and p21 proteins. (H) Real-time RT-PCR analysis of CTGF mRNA expression; n = 3/group, statistical analyses were performed by the paired t test.
Figure 8
Figure 8. p53 activation upregulates CTGF synthesis via repression of the miR-17-92 cluster gene.
(A) HepG2 cells (1.0 × 10⁵) were cotransfected with pTS-589 and pRL-TK for 48 hours and treated with nutlin-3a (20 μM) or recombinant TGF-β (10 ng/ml) for 24 hours. Firefly luciferase and Renilla luciferase activity was measured and is presented as relative luminescence values for firefly luciferase versus Renilla luciferase (F/R). n = 4/group. (B and C) HepG2 cells (1.0 × 10⁵) were treated with nutlin-3a (20 μM) or vehicle for 24 hours. (C) Real-time RT-PCR analysis of miR-17-92 mRNA (B), MIR18A, MIR19A, and MIR19B miRNA expression; n = 3/group. Statistical analyses were performed by the paired t test (AC). (D) HepG2 cells were transfected with a mixture of antisense of MIR18A, MIR19A, and MIR19B at 100 nM each or negative control at 300 nM for 2 days. Expression of CTGF protein was assessed by Western blotting. (E) HepG2 cells were transfected with a mixture of precursor of MIR18A, MIR19A, and MIR19B at 10 nM each or negative control at 30 nM for 2 days and cultured with nutlin-3a (20 μM) or vehicle for 24 hours. Expression of CTGF protein was assessed by Western blotting. (F) Expression of miR-17-92 mRNA in isolated hepatocytes was assessed by real-time RT-PCR. Cre(+), Mdm2fl/flalb-cre; cre(–), Mdm2fl/fl; 5 mice per group.
Figure 9
Figure 9. p53-regulated gene expression increases in fibrotic human liver and is correlated with an increase in CTGF gene expression.
(A and B) A total of 21 non-tumorous human liver samples were subdivided into two groups histologically defined as normal liver and fibrotic liver. p21 (A) and CTGF (B) mRNA levels in the liver were determined by real-time RT-PCR; n = 11 (normal liver group) and n = 10 (fibrotic liver group). (C and D) COL1A1, CTGF, and p21 mRNA levels in the liver of 21 non-tumorous human liver samples were determined by real-time RT-PCR and plotted to analyze the correlation between COL1A1 and CTGF (P < 0.01) (C) or between CTGF and p21 (P < 0.01) (D). (E) miR-17-92 and CTGF mRNA levels in the liver of 10 human fibrotic liver samples were determined by real-time RT-PCR and plotted to analyze the correlation between them (P < 0.01).

References

    1. Vousden KH, Lu X. Live or let die: the cell’s response to p53. Nat Rev Cancer. 2002;2(8):594–604. doi: 10.1038/nrc864. - DOI - PubMed
    1. Bensaad K, et al. TIGAR, a p53-inducible regulator of glycolysis and apoptosis. Cell. 2006;126(1):107–120. doi: 10.1016/j.cell.2006.05.036. - DOI - PubMed
    1. Hu W, Zhang C, Wu R, Sun Y, Levine A, Feng Z. Glutaminase 2, a novel p53 target gene regulating energy metabolism and antioxidant function. Proc Natl Acad Sci U S A. 2010;107(16):7455–7460. doi: 10.1073/pnas.1001006107. - DOI - PMC - PubMed
    1. Crighton D, et al. DRAM, a p53-induced modulator of autophagy, is critical for apoptosis. Cell. 2006;126(1):121–134. doi: 10.1016/j.cell.2006.05.034. - DOI - PubMed
    1. Tyner SD, et al. p53 mutant mice that display early ageing-associated phenotypes. Nature. 2002;415(6867):45–53. doi: 10.1038/415045a. - DOI - PubMed

Substances