. 2011 Aug;121(8):3220-32.
doi: 10.1172/JCI41514. Epub 2011 Jul 11.

Pregnane X receptor activation induces FGF19-dependent tumor aggressiveness in humans and mice

Affiliations

Pregnane X receptor activation induces FGF19-dependent tumor aggressiveness in humans and mice

Hongwei Wang et al. J Clin Invest. 2011 Aug.

Abstract

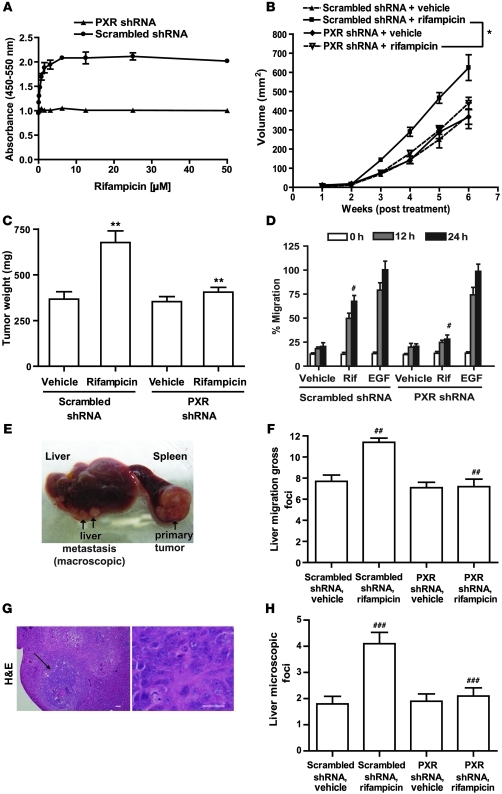
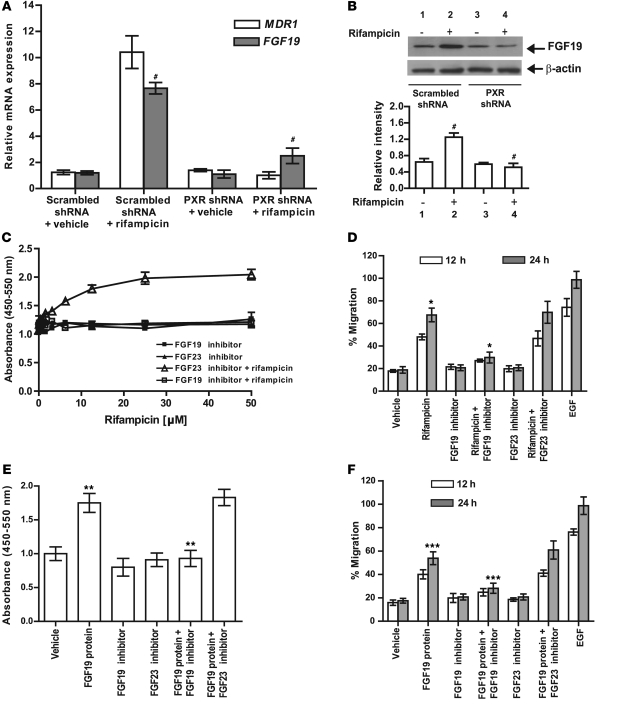
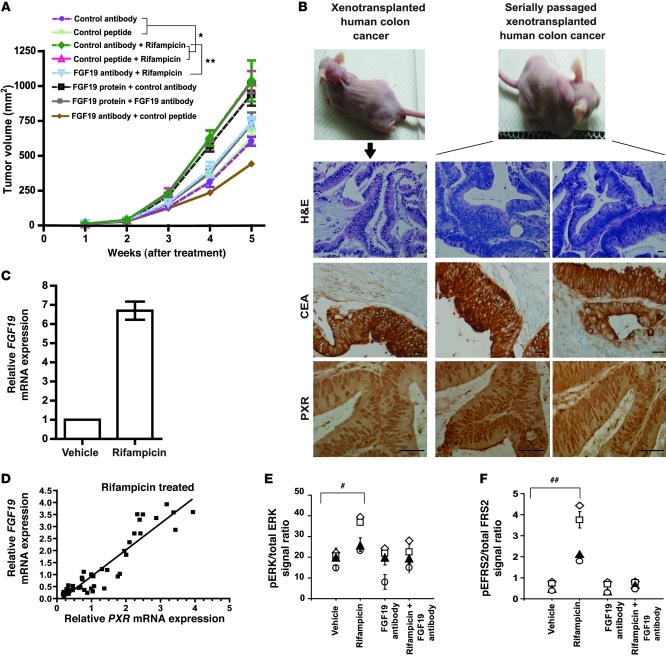
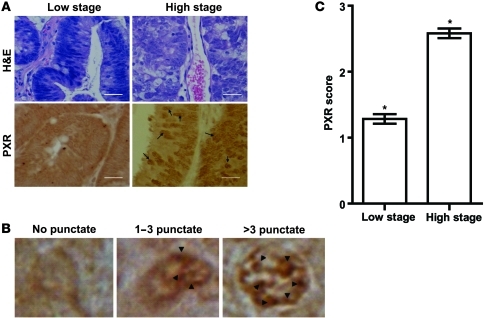
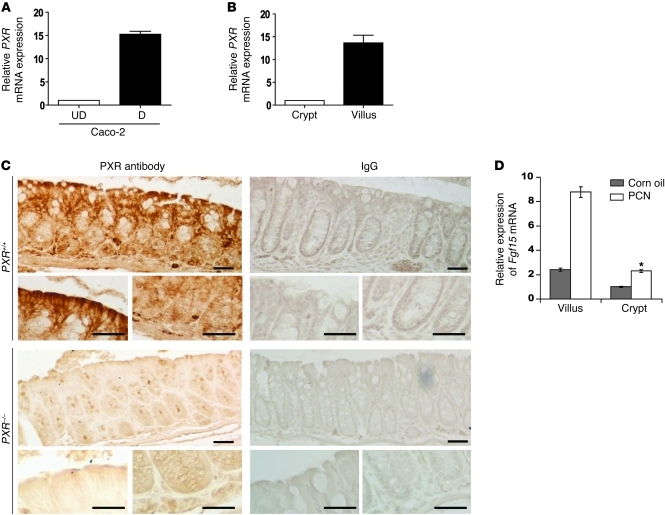
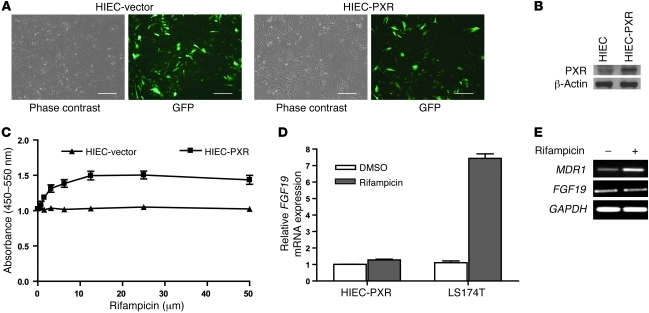
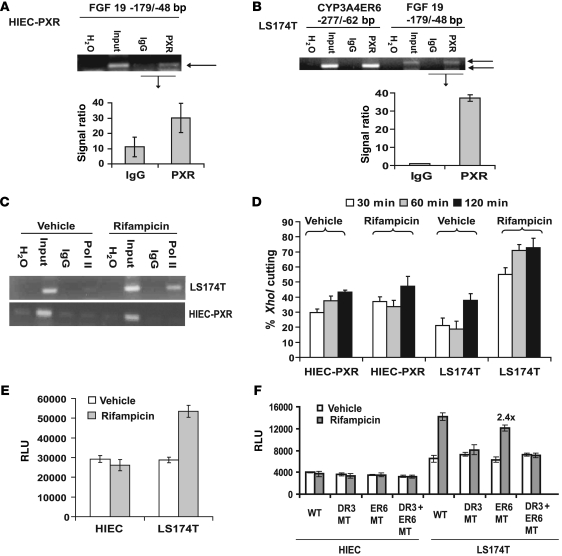
The nuclear receptor pregnane X receptor (PXR) is activated by a range of xenochemicals, including chemotherapeutic drugs, and has been suggested to play a role in the development of tumor cell resistance to anticancer drugs. PXR also has been implicated as a regulator of the growth and apoptosis of colon tumors. Here, we have used a xenograft model of colon cancer to define a molecular mechanism that might underlie PXR-driven colon tumor growth and malignancy. Activation of PXR was found to be sufficient to enhance the neoplastic characteristics, including cell growth, invasion, and metastasis, of both human colon tumor cell lines and primary human colon cancer tissue xenografted into immunodeficient mice. Furthermore, we were able to show that this PXR-mediated phenotype required FGF19 signaling. PXR bound to the FGF19 promoter in both human colon tumor cells and "normal" intestinal crypt cells. However, while both cell types proliferated in response to PXR ligands, the FGF19 promoter was activated by PXR only in cancer cells. Taken together, these data indicate that colon cancer growth in the presence of a specific PXR ligand results from tumor-specific induction of FGF19. These observations may lead to improved therapeutic regimens for colon carcinomas.


Figures

Figure 1
Figure 1. PXR activation induces cell proliferation and cell migration in vitro and in vivo.
(A) Proliferation of LS174T cells expressing either scrambled shRNA or PXR shRNA in response to different concentrations of rifampicin (0–50 μM). (B) Tumor volumes (C) and tumor weights of xenografts of LS174T cells expressing either PXR shRNA or scrambled shRNA (n = 12 per group; day 42). (D) Transwell migration assay performed in the presence or absence of rifampicin (25 μM) or EGF (5 nM). (E) Representative photograph of a spleen-liver pair from a single typical mouse sacrificed on day 14 after intrasplenic inoculation with LS174T cells. There is a 100% metastasis rate to the liver (n = 8 mice; data not shown). The black arrows indicate tumor nodules. (F) Histogram depicts mean gross tumor count on the surface of the liver in 48 mice (n = 12 per group). (G) H&E stain and microscopic examination (scale bar: 200 μm [left panel]; 50 μm [right panel]) of tumor nodules in a mouse liver. The black arrow represents a tumor nodule. (H) Histogram depicts mean microscopic tumor count on the surface of the liver obtained from F. (A and D) n = 4 in triplicate. DMSO (0.2%) was the vehicle for all in vitro experiments. Data are presented as mean ± SEM. *P < 0.001, **P < 0.01, #P < 0.001, ##P < 0.001, ###P < 0.001, comparing the 2 groups as indicated. Rif, rifampicin.
Figure 2
Figure 2. LS174T cell proliferation and migration in response to PXR activation are mediated by induction of FGF19 expression.
(A) Real-time quantitative PCR (QPCR) of FGF19 and MDR1 in LS174T cells expressing either scrambled shRNA or PXR shRNA (stimulated with either rifampicin [10 μM] or vehicle). Gene expression changes were calculated using comparative Ct method, with β-actin as the reference gene and scrambled shRNA plus vehicle as the calibrator. (B) Representative immunoblot analysis of FGF19 from LS174T cells (as in A) exposed to rifampicin (10 μM) or vehicle, with β-actin as loading control. Absolute band intensity (ImageJ; http://rsbweb.nih.gov/ij/) is plotted as a function of lanes from immunoblots. (C) Proliferation of LS174T cells exposed to rifampicin (0–50 μM), FGF23 inhibitor (400 ng/ml), and FGF19 inhibitor (400 ng/ml) as illustrated. (D) Transwell migration assay in the presence or absence of rifampicin (25 μM) or vehicle alone or in combination with FGF19 inhibitor (400 ng/ml) or FGF23 inhibitor (400 ng/ml). (E) Proliferation of LS174T cells that had been stimulated with FGF19 protein (1,000 ng/ml), with or without FGF19 inhibitor (400 ng/ml) or FGF23 inhibitor (400 ng/ml). (F) Transwell migration assay performed with LS174T cells stimulated with rifampicin (25 μM) or vehicle alone or in combination with FGF19 inhibitor (400 ng/ml) and FGF23 inhibitor (400 ng/ml) as illustrated. Data are presented as mean ± SEM. (A and CF) n = 4 in triplicate; (B) n = 3. DMSO (0.2%) was the vehicle for all in vitro experiments. #P < 0.001, *P < 0.001, **P < 0.001, ***P < 0.001.
Figure 3
Figure 3. PXR activation in colon cancer induces tumor growth that is inhibited by FGF19 inhibitory antibody.
(A) Tumor volumes after treatment of human colon tumor xenotransplants (n = 12/group) as illustrated. (B) Serially passaged human colon tumor stained with H&E and antibodies detecting CEA and PXR. Scale bar: 100 μm. (C) Real-time QPCR for FGF19 in vehicle-treated (30% polyethylene glycol) (n = 3) and rifampicin-treated (n = 3) human xenotransplanted tumors (n = 2 with 4 replicates each using the same pooled samples of human tumors). (A and C) Data are presented as mean ± SEM. *P < 0.02, **P <0.01, comparing the 2 groups as indicated. (D) Twice passaged primary human tumors were treated with vehicle or rifampicin (n = 24 per treatment group). The relative FGF19 and PXR mRNA expression was obtained from values normalized to human β-actin. The plot shows FGF19 mRNA levels as a function of PXR mRNA levels determined for the same tumor sample (n = 48; r2 = 0.987) treated with rifampicin. (E and F) Human colon tumors (n = 12/group) were treated with vehicle or rifampicin and/or FGF19 antibody, and tumor tissue lysate (n = 3) was used for pERK/ERK and pFRS2/FRS2 electrochemiluminescence assay. Data are presented as mean (± SD) ratio of signals from all wells per treatment group of phospho-protein/total protein. The signal was plotted as a function of lysate concentrations (0.75 μg, white circle; 1.25 μg, black triangle; 2.5 μg, white square; 5.0 μg: white diamond) used in the assay (n = 4 in triplicate) #P < 0.05, ##P < 0.05.
Figure 4
Figure 4. Nuclear PXR expression correlates with the clinical stage of primary human colon cancer tissue.
(A) A representative primary colon tumor stained with H&E and antibody detecting PXR. Shown are the optimally stained histologic section for a low-stage tumor (AJCC stage I and II) and a high-stage tumor (AJCC stage III and IV). Black arrows indicate the intense punctuate nuclear staining for PXR. Scale bar: 50 μm. (B) Representative enlarged nucleus image (original magnification, ×63), showing no nuclear punctate dots; 1–3 nuclear punctate dots; and more than 3 nuclear punctate dots. Arrowheads indicate punctate dots. (C) The PXR score (based on degree of nuclear staining with PXR antibody; for details, see Methods) is plotted based on the AJCC stage of the tumor (low, n = 45; high, n = 45). Data are presented as mean ± SEM. *P < 0.0001, comparing the 2 groups as indicated.
Figure 5
Figure 5. Expression of PXR and Fgf15 in enterocytes.
Real-time QPCR for PXR in (A) Caco-2 and (B) murine enterocytes. Gene expression changes were calculated using the comparative Ct method, with β-actin as the reference gene and Caco-2 (undifferentiated [UD] cells) or crypt enterocytes as the calibrator, respectively. D, differentiated cells. (C) Immunohistochemical staining of PXR in large intestines (descending colon) from PXR+/+ and PXR–/– mice. Apical villus cells with intense (dark brown) staining of PXR (diffuse cytoplasmic and punctate nuclear). Scale bar: 50 μm. IgG, nonspecific antibody control. (D) Real-time QPCR for Fgf15 (murine ortholog of human FGF19) from murine villus and crypt cell total RNA. The mice had been treated with either PCN (150 mg/kg IP) or corn oil (PCN vehicle) for 3 consecutive days. Two-thirds of the proximal intestines were isolated, and cell fractions were obtained as described in Methods. Gene expression changes were calculated using comparative Ct method, with β-actin as the reference gene and crypt cells as the calibrator (n = 2 per group). (A, B, and D) n = 3 in triplicate. Data are presented as mean ± SEM.
Figure 6
Figure 6. PXR activation induces FGF19 and promoter activity in a cell-type specific manner.
(A) HIECs transfected with pEGFPC1 vector (HIEC) or pEGFPC1-hPXR (HIEC-PXR). Images were captured under appropriate filters (GFP and phase contrast). Scale bar: 100 μm. (B) Representative PXR immunoblot of pooled HIEC nuclear extract (200 μg/lane) from HIEC cells transfected with either pEGFPC1 vector (HIEC) or pEGFPC1-hPXR (HIEC-PXR). (C) Proliferation (BrdU) assay of HIEC-PXR cells and HIECs that had been treated for 48 hours with either rifampicin (0–50 μM) or vehicle (0.2% DMSO). The data is shown as absolute absorbance values (dual spectra 450–550 nm). (D) Real-time QPCR for FGF19 mRNA expression in LS174T and HIEC-PXR cells after cell stimulation with either rifampicin (10 μM) or 0.2% DMSO for 48 hours (n = 3 in quadruplicates). Gene expression changes were calculated using the comparative Ct method, with β-actin as the reference gene and DMSO-treated HIEC-PXR cells as the calibrator. (E) Semiquantitative RT-PCR for FGF19, MDR1, and GAPDH. HIEC-PXR cells had been stimulated for 48 hours with either rifampicin (10 μM) or 0.2% DMSO (vehicle). Data are presented as mean ± SEM.
Figure 7
Figure 7. PXR binds to the endogenous FGF19 promoter and recruits RNA Pol II in LS174T cells.
ChIP analysis of PXR in (A) HIEC-PXR and (B) LS174T cells. The ChIP analysis was performed 5 separate times (each time in duplicate) for QPCR and plotted as a signal ratio between the PXR and IgG lane (FGF19) as illustrated. (C) Pol II bound to endogenous FGF19 promoter in LS174T cells and HIECs overexpressing PXR (HIEC-PXR). (D) XhoI chromatin accessibility assay by real-time PCR (CHART-QPCR) was performed using cell nuclei from rifampicin- or vehicle-treated LS174T and HIEC-PXR cells (for primer sequence details, see Supplemental Table 1). The nuclei were treated with XhoI for 30 to 120 minutes. The XhoI accessibility was expressed as a percentage of the uncut DNA and is plotted against the time of XhoI digestion. All experiments were repeated at least 3 independent times, each in triplicate. CHART-QPCR assays were performed 4 independent times, with 6 repeats per assay point. (E) PXR transactivation assay was performed in LS174T cells and HIECs using the –2,216-bp FGF19 reporter (n = 3 in triplicate). (F) The PXR transactivation assay was performed in LS174T cells and HIECs using FGF19 promoter (–2,216-bp) wild-type, DR3 mutant, and/or ER6 mutant reporter constructs (n = 3 in triplicate). Data are presented as mean ± SEM (± SD is shown for ChIP QPCR data). DMSO (0.2%) was the vehicle for all in vitro experiments. “2.4x” indicates a 2.4 fold change compared with that of vehicle.

Similar articles

Cited by

References

    1. Pasini F, Pelosi G, De Manzoni G, Rosti G. High-dose chemotherapy in small cell lung cancer. Tumori. 2002;88(3):179–186. - PubMed
    1. Ledermann JA. Lessons learned from a decade of clinical trials of high–dose chemotherapy in ovarian cancer. Int J Gynecol Cancer. 2008;18 suppl 1:53–58. - PubMed
    1. Vogl DT, Stadtmauer EA. High-dose chemotherapy and autologous hematopoietic stem cell transplantation for metastatic breast cancer: a therapy whose time has passed. Bone Marrow Transplant. 2006;37(11):985–987. doi: 10.1038/sj.bmt.1705366. - DOI - PubMed
    1. Seidman AD. Sequential single-agent chemotherapy for metastatic breast cancer: therapeutic nihilism or realism? J Clin Oncol. 2003;21(4):577–579. doi: 10.1200/JCO.2003.10.086. - DOI - PubMed
    1. Brabletz T, Jung A, Spaderna S, Hlubek F, Kirchner T. Opinion: migrating cancer stem cells - an integrated concept of malignant tumour progression. Nat Rev Cancer. 2005;5(9):744–749. doi: 10.1038/nrc1694. - DOI - PubMed

Publication types