. 2011 Sep;88(9):1029-44.
doi: 10.1097/OPX.0b013e3182279cfa.

Prentice Award Lecture 2010: A case for peripheral optical treatment strategies for myopia

Affiliations

Prentice Award Lecture 2010: A case for peripheral optical treatment strategies for myopia

Earl L Smith 3rd. Optom Vis Sci. 2011 Sep.

Abstract

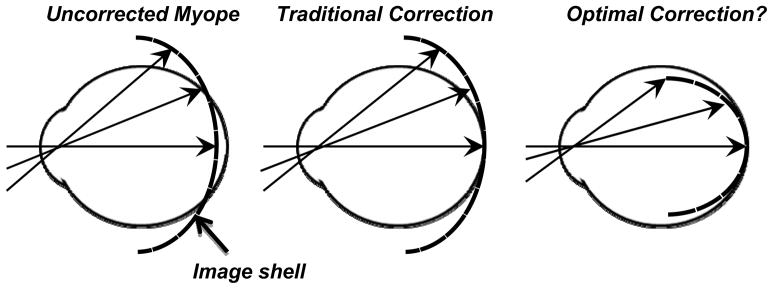
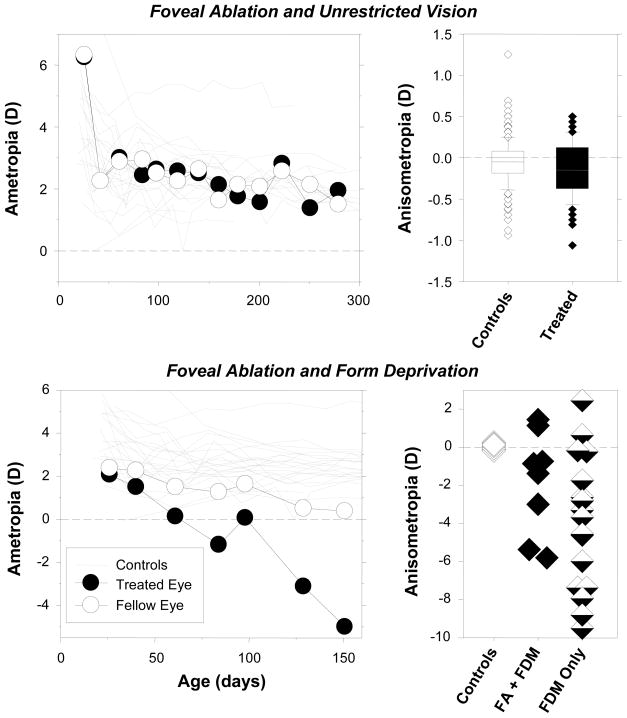
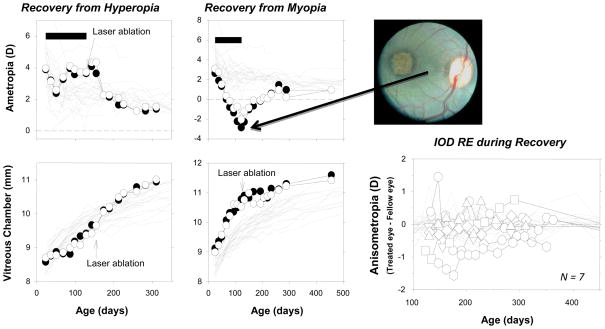
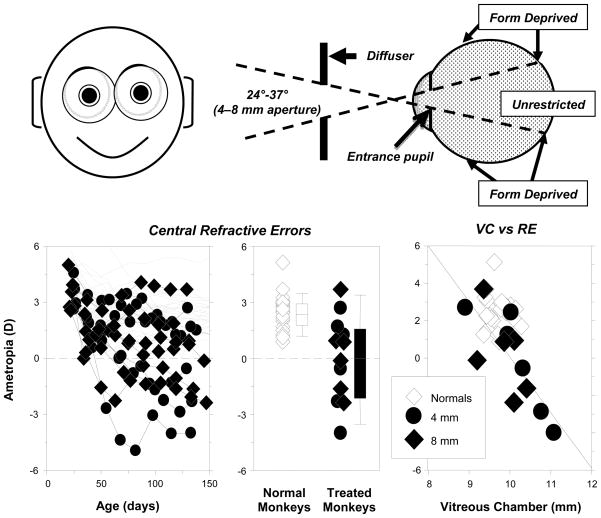
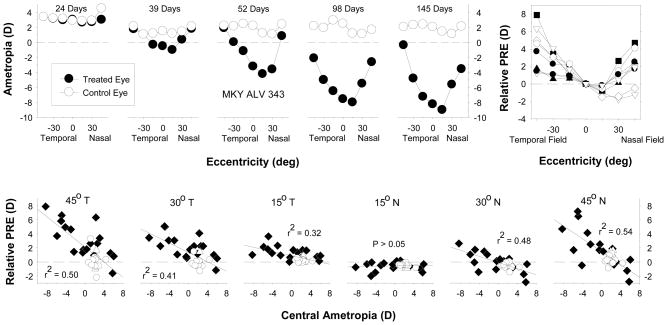
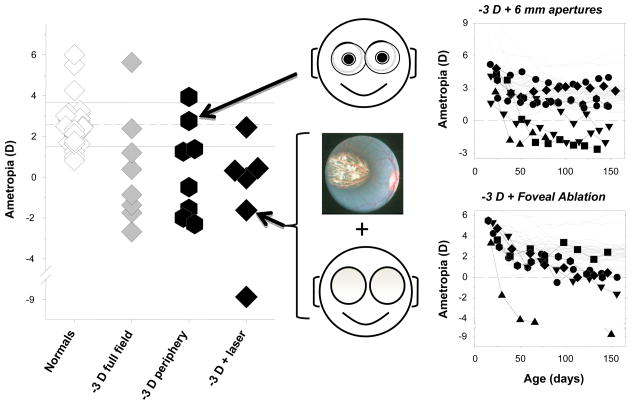
It is well established that refractive development is regulated by visual feedback. However, most optical treatment strategies designed to reduce myopia progression have not produced the desired results, primarily because some of our assumptions concerning the operating characteristics of the vision-dependent mechanisms that regulate refractive development have been incorrect. In particular, because of the prominence of central vision in primates, it has generally been assumed that signals from the fovea determine the effects of vision on refractive development. However, experiments in laboratory animals demonstrate that ocular growth and emmetropization are mediated by local retinal mechanisms and that foveal vision is not essential for many vision-dependent aspects of refractive development. However, the peripheral retina, in isolation, can effectively regulate emmetropization and mediate many of the effects of vision on the eye's refractive status. Moreover, when there are conflicting visual signals between the fovea and the periphery, peripheral vision can dominate refractive development. The overall pattern of results suggests that optical treatment strategies for myopia that take into account the effects of peripheral vision are likely to be more successful than strategies that effectively manipulate only central vision.


Figures

Figure 1
Figure 1
Schematic of the optical goals of a potential peripheral treatment strategy to slow the progression of myopia. The left panel illustrates the position of the image shell for a distant object in a typical unaccommodated myopic eye. The middle panel shows that traditional correcting lenses provide an in focus foveal image but do not correct the relative hyperopia that usually occurs in the periphery. The right panel emphasizes that a fundamental goal of a peripheral treatment strategy would be to provide optimal central vision and at the same time eliminate peripheral visual signals that may stimulate growth and produce visual signals that normally reduce growth.
Figure 2
Figure 2
Results from lens compensation experiments in infant monkeys. Top. Spherical-equivalent spectacle-plane ametropias plotted as function of age for individual monkeys reared with powered spectacle lenses in front of both eyes. The first and last data point for each animal represent the start and end of the lens-rearing period. The powers of the treatment lenses are given in each panel. The monkey shown in the left most plot was treated with progressively increasing powers of positive lenses beginning with +4.5 D and ending with +9 D lenses. All the other monkeys wore the same powered lenses throughout the treatment period. The cross-hatched area shows the mean (± 1 SD) ametropias for normal 4- to 5-month-old infant monkeys. The bottom left plot compares the results of lens compensation experiments in different species (chickens,, tree shrews, marmosets, monkeys). The mean ametropia obtained at the end of the lens-rearing period is plotted as a function of the power of the treatment lenses. In the bottom right panel, the ametropia obtained at the end of the lens-rearing period is plotted as a function of vitreous chamber depth for individual experimental monkeys.
Figure 3
Figure 3
Magnetic resonance images obtained in the horizontal plane for the treated (left) and control eyes (middle) of monkeys reared with monocular full-field form deprivation and monocular nasal-field form deprivation. The nasal and temporal retinas are designated as N and T, respectively. In the right panels, the outlines for the treated (red) and fellow eyes (blue) have been superimposed after rotating the fellow eye images around the optic axes so that the nasal retinas (N) are shown to the right for both eyes. The superimposed images were aligned using the lines that connected the equatorial poles of the crystalline lenses as a reference (the red lines shown in the treated and fellow eye images in the left and middle columns).
Figure 4
Figure 4
Average (±SE) spherical-equivalent refractive corrections obtained at the end of the lens-rearing period (about 4.5 months of age) plotted as a function of horizontal visual field eccentricity for monkeys reared with spectacle lenses that produced either form deprivation (leftmost), 3 D of hyperopic defocus (second from left), or 3 D of myopic defocus in the nasal fields of the treated eyes (second from right). The treated and control eyes are represented by the filled and open symbols, respectively. In the right plot, the interocular differences in refractive error are plotted as a function of the interocular differences in vitreous chamber depth. Individual data are shown for the different visual field eccentricities. The solid line represents the best fitting regression line. NF FD = nasal field form deprivation; NF −3 D = nasal field hyperopic defocus; NF +3 D = nasal field myopic defocus; controls = normal monkeys.
Figure 5
Figure 5
Effects of foveal ablation on refractive development in animals reared with unrestricted vision (top row) and monocular form deprivation (bottom row). The left plots show spherical-equivalent refractive corrections plotted as a function of age for the treated (filled symbols) and control eyes (open symbols) of representative monkeys. The foveal ablations were performed at the onset of the observation period or at the onset of form deprivation. The right plots show the interocular differences in refractive error for individual animals. The top right graph includes data obtained throughout the observation period for 5 treated monkeys and 24 age-matched control monkeys. The horizontal lines in the box plots represent the medians, the bottoms and tops of the boxes represent the 25th and 75th percentiles. The whiskers that extend vertically from the tops and bottoms of the boxes represent the 90th and 10th percentiles, respectively. The diamond symbols represent outliers. The bottom right graph shows data obtained at the end of the lens-rearing period for individual animals. Controls = normal monkeys; FA + FDM = foveal ablation and form deprivation; FDM only = monocular form deprivation.
Figure 6
Figure 6
Effects of foveal ablations on recovery from experimentally induced refractive errors. Left. Spherical-equivalent, spectacle-plane refractive corrections (top) and mean vitreous chamber depths along the pupillary axis (bottom) are plotted as a function of age for the right eyes of individual control animals (thin gray lines) and the laser-treated (filled symbols) and non-lasered fellow eyes (open symbols) of two monkeys that wore binocular peripheral diffusers. The filled horizontal bars in the top plots indicate the lens-rearing periods. The laser photoablations were performed immediately after the lens-rearing period (top right). Right bottom. Interocular differences in refractive error plotted as a function of age for 7 monkeys with experimentally induced refractive errors that had the fovea of one eye ablated via laser photocoagulation at the end of the lens-rearing period. The first symbol for each animal represents the start of the recovery period. The thin gray lines represent data from the control monkeys.
Figure 7
Figure 7
Effects of peripheral form deprivation on refractive development. Top. Schematic illustrating the effects of the treatment lenses. Bottom left. Spherical-equivalent refractive corrections measured along the pupillary axis plotted as a function of age for the right eyes of individual control animals (thin gray lines) and treated monkeys (filled symbols) reared with diffusers with 4 mm (diamonds) and 8 mm apertures (circles). Bottom middle. Refractive errors for treated (diamonds, 4 mm apertures; circles, 8 mm apertures) and control animals at ages corresponding to the end of the period of peripheral form deprivation. The open and filled bars indicate the median and the 10th, 25th, 50th, and 90th percentiles for the control and treated monkeys, respectively. Bottom right. Vitreous chamber depth plotted as a function of spherical-equivalent refractive error for treated (diamonds, 4 mm apertures; circles, 8 mm apertures) and control animals at ages corresponding to the end of the treatment period. The line represents the results from the regression analysis of the data from the treated monkeys.
Figure 8
Figure 8
Effects of form deprivation on the pattern of peripheral refractive errors. Top. Spherical-equivalent refractive corrections that were obtained at different times during the treatment period for a representative diffuser-reared monkey plotted as a function of visual field eccentricity. The plot on the left was obtained at the onset of the treatment period; the ages for the subsequent measures are shown in each plot. The filled and open symbols represent the treated and fellow eyes, respectively. Top right. Relative interocular differences in spherical-equivalent refractive corrections (treated eye - fellow eye) plotted as a function of eccentricity along the horizontal meridian for individual diffuser-reared monkeys that exhibited central axial myopia. Bottom row. Relative peripheral refractive corrections (peripheral – central refraction) for the treated eyes of individual normal (open circles) and form-deprived monkeys (filled diamonds) plotted as a function of the central ametropia for different horizontal field eccentricities. The solid lines represent the best-fitting regression lines.
Figure 9
Figure 9
Effects of relative peripheral hyperopia on refractive development. Left. Spherical-equivalent refractive corrections obtained at ages corresponding to the end of the lens-rearing period for monkeys that were reared with unrestricted vision, wearing −3 D lenses that covered the entire visual field, wearing −3 D lenses with 6 mm apertures that produced relative peripheral hyperopia, and wearing full-field −3 D spectacle combined with foveal ablation. Right. Refractive error plotted as a function of age for normal monkeys (thin gray lines) and monkeys reared with −3 D lenses with 6 mm apertures (filled symbols, top) or full-field −3 D lenses and foveal ablations (filled symbols, bottom).
Figure 10
Figure 10
Relative efficacy of optical treatment strategies for slowing myopia progression. For most of the studies, refractive-error data were used to calculate the percentage difference in progression rate between the treated and control groups. For the orthokeratology trials measures of vitreous chamber depth or axial length were employed to calculate the differences in axial elongation rate between the treated and control groups. The data for traditional bifocals and progressive addition lenses were obtained from references , , , . The results for under-correction strategies were obtained from references , . The results for strategies which included significant peripheral components were obtained from for spectacle lenses, for contact lenses, for orthokeratology, for executive bifocals, and for multi-focal contact lenses.

Similar articles

Cited by

References

    1. Sperduto RD, Seigel D, Roberts J, Rowland M. Prevalence of myopia in the United States. Arch Ophthalmol. 1983;101:405–7. - PubMed
    1. Lin LL, Shih YF, Hsiao CK, Chen CJ. Prevalence of myopia in Taiwanese schoolchildren: 1983 to 2000. Ann Acad Med Singapore. 2004;33:27–33. - PubMed
    1. Hosaka A. Population studies—myopia experience in Japan. Acta Ophthalmol Suppl. 1988;185:37–40. - PubMed
    1. Woo WW, Lim KA, Yang H, Lim XY, Liew F, Lee YS, Saw SM. Refractive errors in medical students in Singapore. Singapore Med J. 2004;45:470–4. - PubMed
    1. Wu MM, Edwards MH. The effect of having myopic parents: an analysis of myopia in three generations. Optom Vis Sci. 1999;76:387–92. - PubMed

Publication types