

doi: 10.1038/nbt.1910.
Sequencing technology does not eliminate biological variability
- PMID: 21747377
- PMCID: PMC3137276
- DOI: 10.1038/nbt.1910
Item in Clipboard
Sequencing technology does not eliminate biological variability
Nat Biotechnol.
.
Abstract
RNA sequencing has generated much excitement for the advantages offered over microarrays. This excitement has led to a barrage of publications discounting the importance of biological variability; as microarray publications did in the 1990s. By comparing microarray and sequencing data, we demonstrate that expression measurements exhibit biological variability across individuals irrespective of measurement technology. Our analysis suggests RNA-sequencing experiments designed to estimate biological variability are more likely to produce reproducible results.
Figures
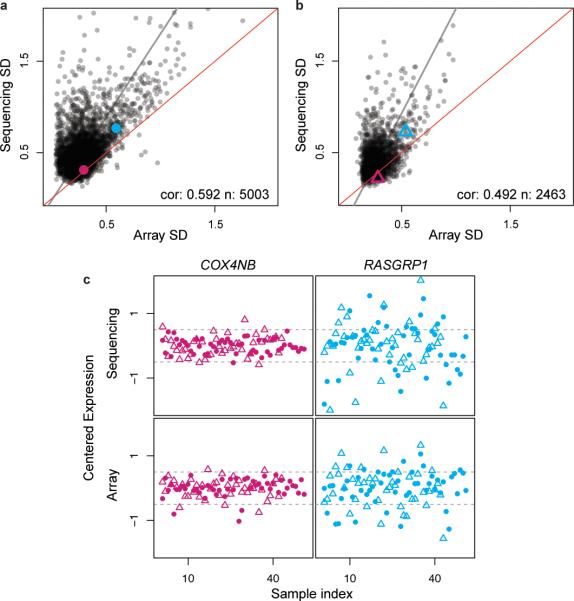
Biological variability measured with sequencing and microarrays. (a) A plot of the standard deviation of expression values as measured with microarrays in the Stranger et al. study (x-axis) and sequencing in the Montgomery et al. study (y-axis). The estimates of expression variability from sequencing are similar to the estimates from microarrays. (b) A plot of the standard deviation of expression values as measured with microarrays in the Choy et al. study (x-axis) and the Pickrell et al. study (y-axis). The estimates of expression variability from sequencing are again almost the same as estimates from microarrays. (c) A plot of the expression for two genes COX4NB (left column, pink) and RASGRP1 (right column, blue) as measured with sequencing (top row) and microarrays (bottom row) versus biological sample. Mean-centered measurements from the two studies are plotted as circles and triangles, respectively. The standard deviations for the two genes are highlighted in a,b. The plot shows that regardless of the measurement technology or study COX4NB expression is much less variable than RASGRP1 expression.
References
-
- Mortazavi A, Williams BA, McCue K, Schaeffer L, Wold B. Mapping and quantifying mammalian transcriptomes by RNA-Seq. Nat Methods. 2008;5:621–628. - PubMed
Publication types
MeSH terms
Substances
Grants and funding
LinkOut - more resources
Full Text Sources
