

Inferring the population expansions in peopling of Japan
- PMID: 21747908
- PMCID: PMC3126835
- DOI: 10.1371/journal.pone.0021509
Inferring the population expansions in peopling of Japan
Abstract
Background: Extensive studies in different fields have been performed to reconstruct the prehistory of populations in the Japanese archipelago. Estimates the ancestral population dynamics based on Japanese molecular sequences can extend our understanding about the colonization of Japan and the ethnogenesis of modern Japanese.
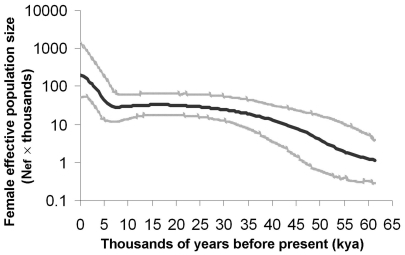
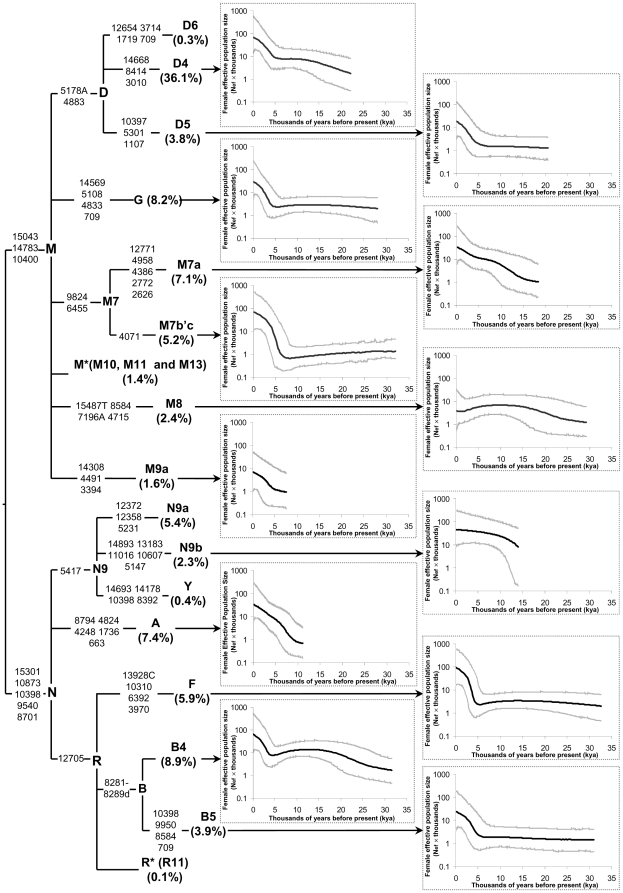
Methodology/principal findings: We applied Bayesian skyline plot (BSP) with a dataset based on 952 Japanese mitochondrial DNA (mtDNA) genomes to depict the female effective population size (N(ef)) through time for the total Japanese and each of the major mtDNA haplogroups in Japanese. Our results revealed a rapid N(ef) growth since ∼5 thousand years ago had left ∼72% Japanese mtDNA lineages with a salient signature. The BSP for the major mtDNA haplogroups indicated some different demographic history.
Conclusions/significance: The results suggested that the rapid population expansion acted as a major force in shaping current maternal pool of Japanese. It supported a model for population dynamics in Japan in which the prehistoric population growth initiated in the Middle Jomon Period experienced a smooth and swift transition from Jomon to Yayoi, and then continued through the Yayoi Period. The confounding demographic backgrounds of different mtDNA haplogroups could also have some implications for some related studies in future.
Conflict of interest statement
Figures
Similar articles
-
Population dynamics in the Japanese Archipelago since the Pleistocene revealed by the complete mitochondrial genome sequences.Sci Rep. 2021 Jun 13;11(1):12018. doi: 10.1038/s41598-021-91357-2. Sci Rep. 2021. PMID: 34121089 Free PMC article.
-
Analysis of whole Y-chromosome sequences reveals the Japanese population history in the Jomon period.Sci Rep. 2019 Jun 17;9(1):8556. doi: 10.1038/s41598-019-44473-z. Sci Rep. 2019. PMID: 31209235 Free PMC article.
-
Dual origins of the Japanese: common ground for hunter-gatherer and farmer Y chromosomes.J Hum Genet. 2006;51(1):47-58. doi: 10.1007/s10038-005-0322-0. Epub 2005 Nov 18. J Hum Genet. 2006. PMID: 16328082
-
Bayesian coalescent inference of major human mitochondrial DNA haplogroup expansions in Africa.Proc Biol Sci. 2009 Jan 22;276(1655):367-73. doi: 10.1098/rspb.2008.0785. Proc Biol Sci. 2009. PMID: 18826938 Free PMC article.
-
Japan considered from the hypothesis of farmer/language spread.Evol Hum Sci. 2020 May 5;2:e13. doi: 10.1017/ehs.2020.7. eCollection 2020. Evol Hum Sci. 2020. PMID: 37588377 Free PMC article. Review.
Cited by
-
Mitogenomic Meta-Analysis Identifies Two Phases of Migration in the History of Eastern Eurasian Sheep.Mol Biol Evol. 2015 Oct;32(10):2515-33. doi: 10.1093/molbev/msv139. Epub 2015 Jun 16. Mol Biol Evol. 2015. PMID: 26085518 Free PMC article.
-
Munda languages are father tongues, but Japanese and Korean are not.Evol Hum Sci. 2020 May 29;2:e19. doi: 10.1017/ehs.2020.14. eCollection 2020. Evol Hum Sci. 2020. PMID: 37588351 Free PMC article. Review.
-
Ancient mitochondrial genome reveals trace of prehistoric migration in the east Pamir by pastoralists.J Hum Genet. 2016 Feb;61(2):103-8. doi: 10.1038/jhg.2015.128. Epub 2015 Oct 29. J Hum Genet. 2016. PMID: 26511065
-
Chromosome painting in silico in a bacterial species reveals fine population structure.Mol Biol Evol. 2013 Jun;30(6):1454-64. doi: 10.1093/molbev/mst055. Epub 2013 Mar 16. Mol Biol Evol. 2013. PMID: 23505045 Free PMC article.
References
-
- Hudson MJ. Honolulu: University of Hawai'i Press; 1999. Ruins of identity: ethnogenesis in the Japanese Islands.336
-
- Cavalli-Sforza LL, Menozzi P, Piazza A. Princeton: Princeton University Press; 1994. The history and geography of human genes.1088
-
- Hanihara K. Dual structure model for the population history of the Japanese. Jpn Rev. 1991;2:1–31.
-
- Omoto K, Saitou N. Genetic origins of the Japanese: a partial support for the dual structure hypothesis. Am J Phys Anthropol. 1997;102:437–446. - PubMed
Publication types
MeSH terms
Substances
LinkOut - more resources
Full Text Sources
