. 2011;6(7):e21232.
doi: 10.1371/journal.pone.0021232. Epub 2011 Jul 1.

Metabolic programming during lactation stimulates renal Na+ transport in the adult offspring due to an early impact on local angiotensin II pathways

Affiliations

Metabolic programming during lactation stimulates renal Na+ transport in the adult offspring due to an early impact on local angiotensin II pathways

Ricardo Luzardo et al. PLoS One. 2011.

Abstract

Background: Several studies have correlated perinatal malnutrition with diseases in adulthood, giving support to the programming hypothesis. In this study, the effects of maternal undernutrition during lactation on renal Na(+)-transporters and on the local angiotensin II (Ang II) signaling cascade in rats were investigated.

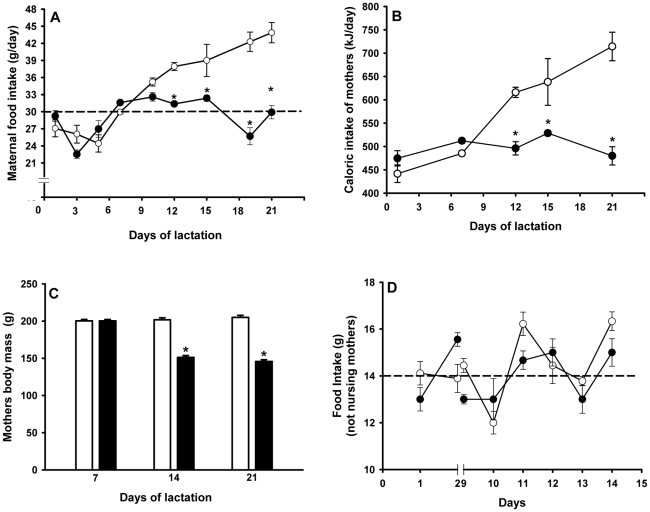
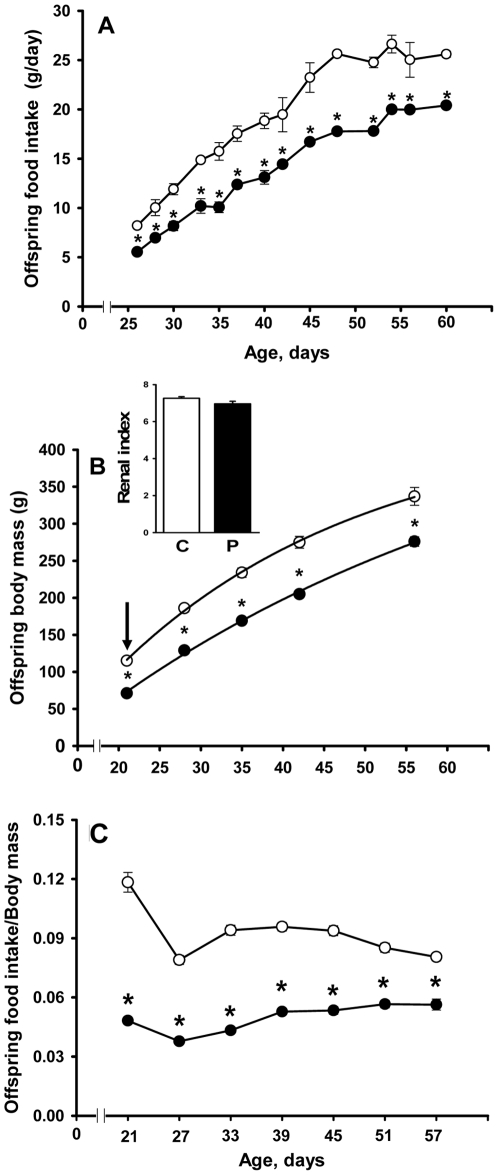
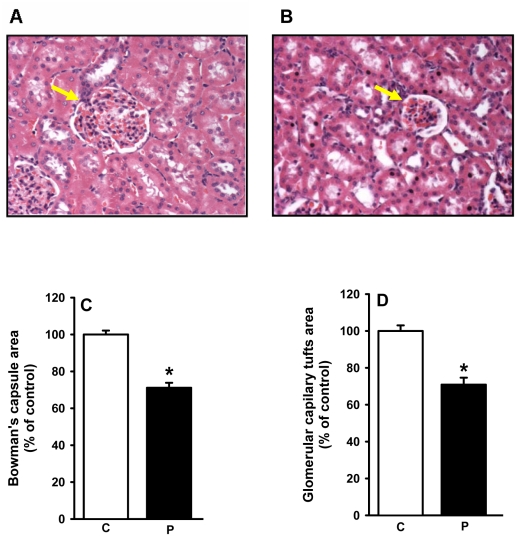
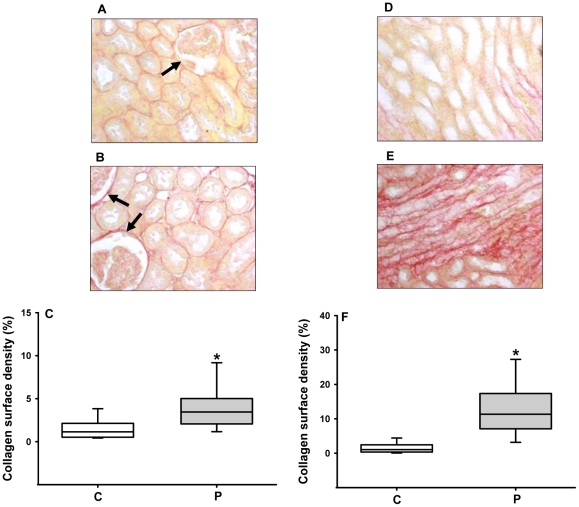
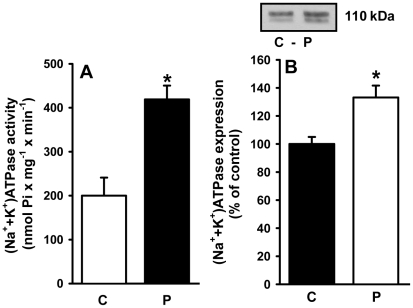
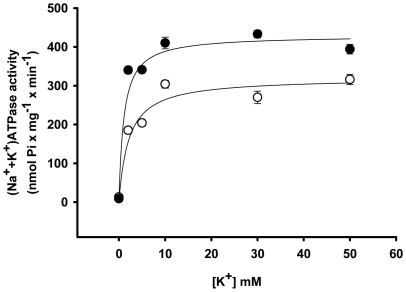
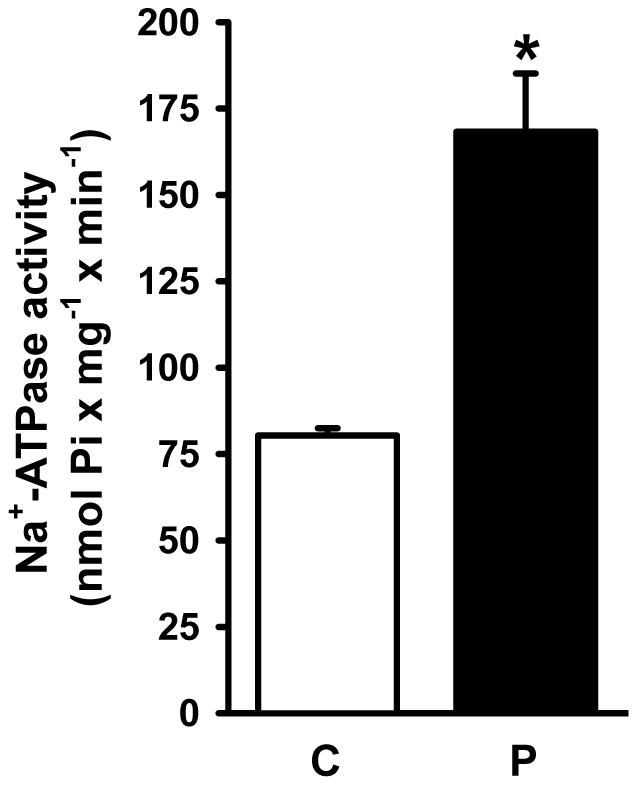
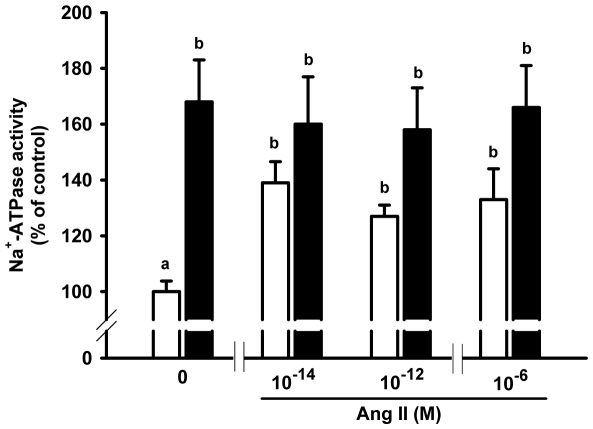
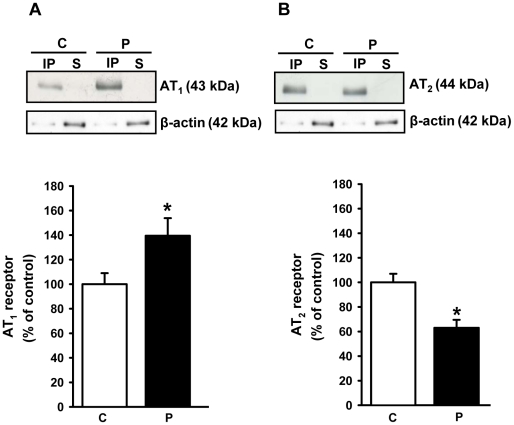
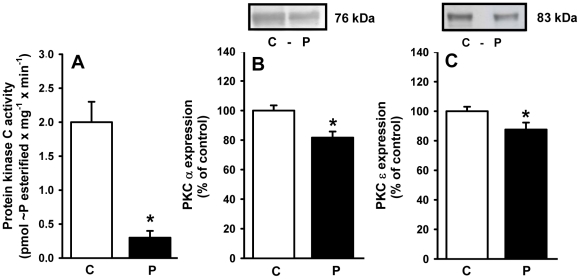
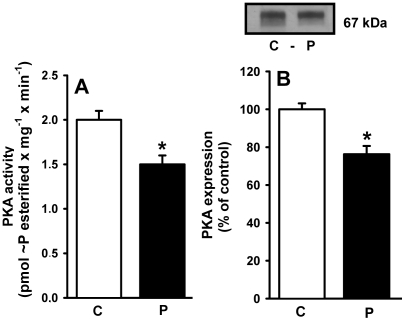
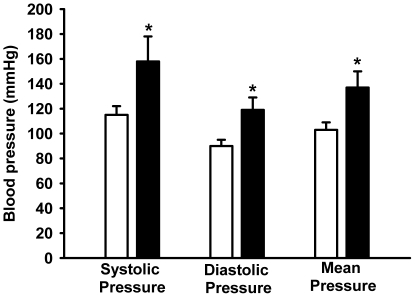
Methodology/principal findings: Female rats received a hypoproteic diet (8% protein) throughout lactation. Control and programmed offspring consumed a diet containing 20% protein after weaning. Programming caused a decrease in the number of nephrons (35%), in the area of the Bowman's capsule (30%) and the capillary tuft (30%), and increased collagen deposition in the cortex and medulla (by 175% and 700%, respectively). In programmed rats the expression of (Na(+)+K(+))ATPase in proximal tubules increased by 40%, but its activity was doubled owing to a threefold increase in affinity for K(+). Programming doubled the ouabain-insensitive Na(+)-ATPase activity with loss of its physiological response to Ang II, increased the expression of AT(1) and decreased the expression of AT(2) receptors), and caused a pronounced inhibition (90%) of protein kinase C activity with decrease in the expression of the α (24%) and ε (13%) isoforms. Activity and expression of cyclic AMP-dependent protein kinase decreased in the same proportion as the AT(2) receptors (30%). In vivo studies at 60 days revealed an increased glomerular filtration rate (GFR) (70%), increased Na(+) excretion (80%) and intense proteinuria (increase of 400% in protein excretion). Programmed rats, which had normal arterial pressure at 60 days, became hypertensive by 150 days.

Conclusions/significance: Maternal protein restriction during lactation results in alterations in GFR, renal Na(+) handling and in components of the Ang II-linked regulatory pathway of renal Na(+) reabsorption. At the molecular level, they provide a framework for understanding how metabolic programming of renal mechanisms contributes to the onset of hypertension in adulthood.


Conflict of interest statement

Competing Interests: The authors have declared that no competing interests exist.

Figures

Figure 1
Figure 1. Maternal data: food and caloric intake, and body mass during lactation.
(A) Mothers were given a control (open circles) or low-protein (filled circles) diet from parturition until the end of lactation. Diet compositions are described in Table 1. Dashed line indicates the mean value of chow ingestion by undernourished mothers during this period. Data are means ± S.E.M. (n = 10 in each group). (B) Maternal caloric intake (control, open circles; low-protein filled circles) during the indicated days of lactation calculated from: diet composition (Table 1), food intake (panel A), the caloric value of proteins (16.74×10³ kJ/kg), carbohydrates (16.74×10³ kJ/kg) and fat (37.66 kJ/kg), and a soybean oil average density of 926 kg/m3 according to the manufacturer. Data are means ± S.E.M. (n = 4 in each group). (C) Maternal body mass at the end of each week of lactation in control (empty bars) and low-protein-fed rats (filled bars). (D) Food intake by female rats (open circles for control; filled circles for low-protein) that were not nursing pups. Dashed line indicates the mean value of chow ingestion. In (A), (B) and (C): *statistically different from the corresponding control group (P<0.05 or less depending on the lactation day).
Figure 2
Figure 2. Food intake of offspring, evolution of progeny body mass after weaning, and relationship between body mass and food intake.
zz(A) The offspring of control (open circles) and undernourished (filled circles) mothers were given a standard commercial diet from weaning to sacrifice. Data are means ± SEM (n = 14, control; n = 18, programmed). (B) The trajectories of growth in control (open circles) and programmed (filled circles) offspring were described by the function BMt = BMasy (1−ekt), where BMt is body mass at each indicated time t, BMasy corresponds to the asymptotic value of the function and k is the first-order rate constant of growth. T1/2 was calculated by ln 2/k). Data points correspond to means ± SEM (n = 14, control; n = 18, programmed). The arrow indicates the significantly reduced body mass at weaning. Inset: kidney index calculated as the ratio between kidney mass and body mass (C: control; P: programmed). (C) Data points correspond to the ratio between the food intake at the indicated days (during 24 h) and body mass in control (open circles) and programmed (filled circles) offspring. In (A), (B) and (C): *statistically different from the corresponding control group (P<0.05 or less depending on the age).
Figure 3
Figure 3. Number of nephrons in control and programmed offspring.
After mechanical dissociation of the tubules, the number of glomeruli was evaluated by counting under light microscopy as described in the Materials and Methods. For the number of animals, number of homogenate samples, number of independent observations, total nephron count, intra- and inter-assay variability controls see Materials and Methods. (C: control; P: programmed). Statistical differences were assessed using the Mann-Whitney U-test. (A) Total number of nephrons per kidney; median = 18664 for control; median = 14331 for programmed; U = 88, *P<0.001. (B) Number of nephrons per g of kidney; median = 6436 for control; median = 5138 for programmed; U = 170.5, *P<0.01).
Figure 4
Figure 4. Glomerular morphometry in control and programmed offspring.
The areas of the Bowman's capsule and of the capillary tuft in the cross section of glomeruli were assessed as described in the Materials and Methods. For number of rats, number of screened tissue sections and number of glomeruli counted, see Materials and Methods. Panels A and B show representative photomicrographs (200×) of HE-stained sagital kidney sections of control and programmed rats, respectively. Arrows indicate glomerular structures. Panel C: quantification of the Bowman's capsule area expressed as a percentage of the control group. Results were statistically analyzed and then converted to percentage values (n = 3; *P<0.001). Panel D: quantification of the capillary tuft area expressed as a percentage of the control group (n = 3; *P<0.001). On the abscissae of panels (C) and (D), the capital letters C and P indicate the control and programmed groups, respectively.
Figure 5
Figure 5. Collagen deposition in the cortical and medullary regions.
Collagen surface density was quantified as described in the Materials and Methods (n = 3 for each group). Panels A and B present representative Picro Sirius-stained sagital cortex sections of control and programmed rats, respectively. Panel C: graphic representation of collagen surface density in the cortex. Arrows indicate pericapsular collagen deposits and, in the case of panel B, a large-size glomerulus in the predominat population of glomeruli with decreased volume. Panels D and E present representative medullary images from control and programmed rats, respectively. Panel F: graphic representation of collagen surface density in the medulla. Statistical differences were assayed using the Mann-Whitney U-test. On the abscissae of panels (C) and (F), the capital letters C and P indicate the control and programmed groups, respectively. In (C) median for control = 1.14; median for programmed = 3.44; U = 179; P<0.0001. In (F) median for control = 1.05; median for programmed = 11.32; U = 49; P<0.0001).
Figure 6
Figure 6. Activity and expression of (Na++K+)ATPase in basolateral membranes of kidney proximal tubule cells.
(A) (Na++K+)ATPase activity was measured in membranes isolated from control (C) and programmed (P) offspring, as indicated on the abscissa. Data are means ± S.E.M. of six (control) and eight (programmed) determinations carried out in triplicate using different membrane (rat) preparations. *Statistically different from C (P<0.01). (B) Expression of (Na++K+)ATPase. Upper panel: representative immunoblotting of α1 subunit. Lower panel: densitometric quantification (means ± S.E.M.) of five simultaneous determinations carried out with four different membrane preparations from each group (C and P). The band intensity of the control group was taken as 100%. *Statistically different from the control group (P<0.05).
Figure 7
Figure 7. Apparent affinity for K+ of renal (Na++K+)ATPase.
The (Na++K+)ATPase activity was assayed at the K+ concentrations presented on the abscissa (starting with a contaminant concentration of 0.1 mM K+ according to flame photometric determinations performed after preparation of the solution was completed). The Na+ concentrations ranged from 150 to 100 mM to keep the sum of Na+ plus K+ concentrations equal to 150 mM in all tubes. The hyperbolic function v = Vmax×[K+]/(K0.5+[K+]) was adjusted to the experimental points obtained with the use of membranes isolated from control (open circles) and programmed (filled circles) offspring. Data are means ± S.E.M. of at least seven determinations carried out in triplicate with four different preparations from each group (C and P). The abbreviations of the expression correspond to activity at each K+ concentration (v), extrapolated maximal velocity (Vmax) and to the K+ concentration at which v = Vmax/2 (K0.5).
Figure 8
Figure 8. Ouabain-insensitive Na+-ATPase activity.
The Na+-ATPase activity was assayed in membranes isolated from control (C) and programmed (P) offspring, as indicated on the abscissa. Data are means ± S.E.M. of 11 determinations (both groups) carried out in triplicate using four different membrane preparations from each group (C and P). *Statistically different from the control group (P<0.001).
Figure 9
Figure 9. Response of the ouabain-insensitive Na+-ATPase to Ang II.
Na+-ATPase activity from basolateral membranes of control (open bars) and programmed (filled bars) offspring was assayed in the absence or presence of Ang II at the concentrations presented on the abscissa. Mean activity values and standard errors were calculated from the absolute values and expressed as percentages (see Statistical Analysis sub-section). Na+-ATPase activity of control with no Ang II was taken as 100%. Different lower-case letters indicate statistical difference (P<0.05; one-way ANOVA to evaluate Ang II effects within each group and two-way ANOVA followed by Bonferroni test for the comparison of Ang II effects between control and programmed groups). Determinations were carried out in triplicate using different preparations (n = 5 for each group at each Ang II concentration).
Figure 10
Figure 10. Expression of Ang II receptors.
Ang II receptors (AT1 and AT2) were immunodetected in proximal tubule cell membranes of control (C) and programmed (P) offspring. (A) AT1 receptors. (B) AT2 receptors. In (A) and (B): upper panels show representative immunoblots after immunoprecipitation with the corresponding antibodies (IP, immunoprecitate; S, supernatant); middle panels show immunodetection of β-actin probed in the same membrane, which was used to asses protein loading in the gels; lower panels show densitometric quantification (means ± S.E.M.) of five immunodetections carried out with different membrane preparations. The band intensity of the respective control group was taken as 100%. *Statistically different from the control group (P<0.05).
Figure 11
Figure 11. Activity and expression of calphostin-sensitive protein kinase C (PKC) in membranes from proximal tubule cells of control (C) and programmed (P) offspring.
(A) PKC activity measured in six different membrane (rats) preparations. The results are means ± S.E.M. *Statistically different from C (P<0.001). (B) and (C) Immunodetection of the calphostin-sensitive α and ε isoforms of PKC, respectively. Upper panels: representative immunoblottings. Lower panels: densitometric quantification (means ± S.E.M.) of five immunodetections carried out with different membrane preparations. The band intensity of the respective control group was taken as 100%. *Statistically different from the control group (P<0.05).
Figure 12
Figure 12. Activity and expression of cAMP-dependent protein kinase (PKA) in membranes from proximal tubule cells of control (C) and programmed (P) offspring.
(A) PKA activity measured in six different membrane (rats) preparations. The results are means ± S.E.M. *Statistically different from the control group (P<0.05). (B) Immunodetection of PKA α-catalytic subunit. Upper panel: representative immunoblotting. Lower panel: densitometric quantification (means ± S.E.M.) of five immunodetections carried out with different membrane preparations. The band intensity of the respective control group was taken as 100%. *Statistically different from the control group (P<0.05).
Figure 13
Figure 13. Later increase in arterial blood pressure in programmed offspring.
Blood pressure was recorded in rats aged 150 days as described in the Materials and Methods (control, empty bars; programmed, filled bars). Data are means ± S.E.M. (n = 5 in both groups). *Statiscally different from the control group (P<0.05).

References

    1. Food and Agriculture Organization of the United Nations website. Available: http://www.fao.org/docrep/012/al390e/al390e00.pdf. Accessed 2011 April 19.
    1. Barker DJ. Maternal nutrition and cardiovascular disease. Nutr Health. 1993;9:99–106. - PubMed
    1. Barker DJ. Mothers, babies, and disease in later life. London: BMJ Publishing Group; 1994. 232
    1. Barker DJ. Fetal nutrition and cardiovascular disease in later life. British Med Bull. 1997;53:96–108. - PubMed
    1. Barker DJ. Fetal programming of coronary heart disease. Endocrinology & Metabolism. 2002;13:364–368. - PubMed

Publication types

MeSH terms