

Fatal outcome in bacteremia is characterized by high plasma cell free DNA concentration and apoptotic DNA fragmentation: a prospective cohort study
- PMID: 21747948
- PMCID: PMC3128600
- DOI: 10.1371/journal.pone.0021700
Fatal outcome in bacteremia is characterized by high plasma cell free DNA concentration and apoptotic DNA fragmentation: a prospective cohort study
Abstract
Introduction: Recent studies have shown that apoptosis plays a critical role in the pathogenesis of sepsis. High plasma cell free DNA (cf-DNA) concentrations have been shown to be associated with sepsis outcome. The origin of cf-DNA is unclear.
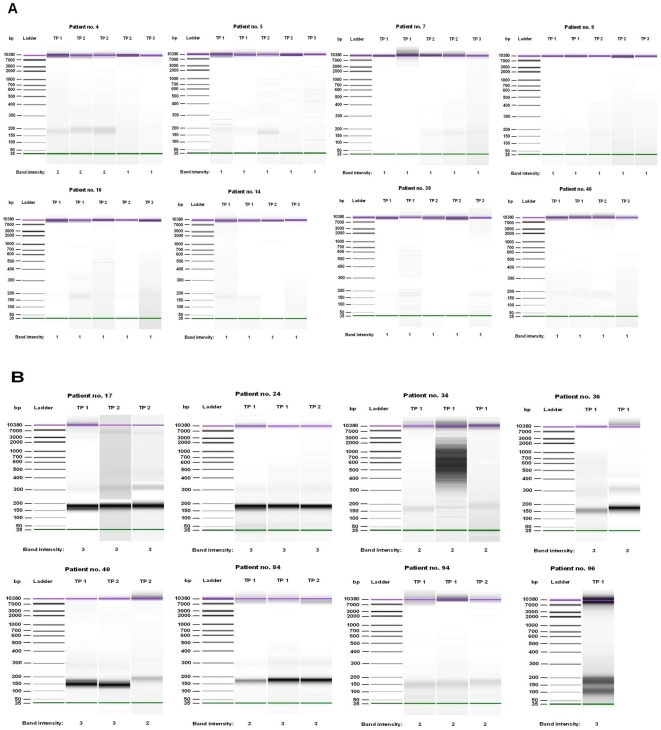
Methods: Total plasma cf-DNA was quantified directly in plasma and the amplifiable cf-DNA assessed using quantitative PCR in 132 patients with bacteremia caused by Staphylococcus aureus, Streptococcus pneumoniae, ß-hemolytic streptococcae or Escherichia coli. The quality of cf-DNA was analyzed with a DNA Chip assay performed on 8 survivors and 8 nonsurvivors. Values were measured on days 1-4 after positive blood culture, on day 5-17 and on recovery.
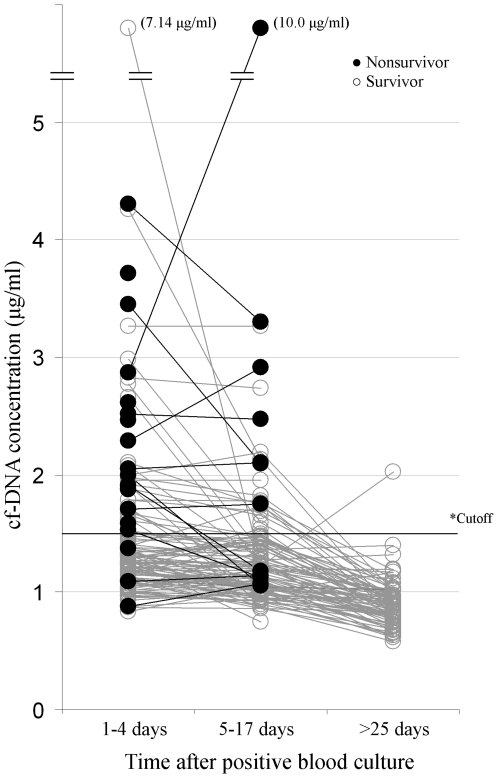
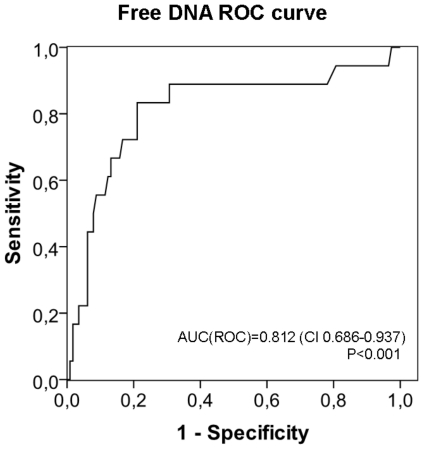
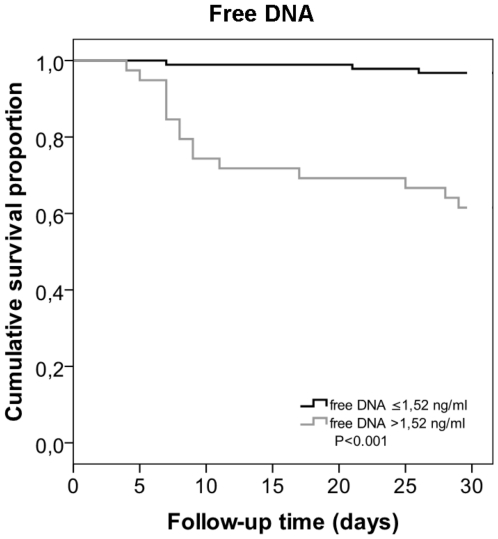
Results: The maximum cf-DNA values on days 1-4 (n = 132) were markedly higher in nonsurvivors compared to survivors (2.03 vs 1.26 ug/ml, p<0.001) and the AUCROC in the prediction of case fatality was 0.81 (95% CI 0.69-0.94). cf-DNA at a cut-off level of 1.52 ug/ml showed 83% sensitivity and 79% specificity for fatal disease. High cf-DNA (>1.52 ug/ml) remained an independent risk factor for case fatality in a logistic regression model. Qualitative analysis of cf-DNA showed that cf-DNA displayed a predominating low-molecular-weight cf-DNA band (150-200 bp) in nonsurvivors, corresponding to the size of the apoptotic nucleosomal DNA. cf-DNA concentration showed a significant positive correlation with visually graded apoptotic band intensity (R = 0.822, p<0.001).
Conclusions: Plasma cf-DNA concentration proved to be a specific independent prognostic biomarker in bacteremia. cf-DNA displayed a predominating low-molecular-weight cf-DNA band in nonsurvivors corresponding to the size of apoptotic nucleosomal DNA.
Conflict of interest statement
Figures
References
-
- Hotchkiss RS, Nicholson DW. Apoptosis and caspases regulate death and inflammation in sepsis. Nat Rev Immunol. 2006;6:813–22. - PubMed
-
- Hotchkiss RS, Swanson PE, Freeman BD, Tinsley KW, Cobb JP, et al. Apoptotic cell death in patients with sepsis, shock, and multiple organ dysfunction. Crit Care Med. 1999;27:1230–51. - PubMed
-
- Hotchkiss RS, Karl IE. The pathophysiology and treatment of sepsis. N Engl J Med. 2003;348:138–50. - PubMed
-
- Papathanassoglou ED, Moynihan JA, Ackerman MH. Does programmed cell death (apoptosis) play a role in the development of multiple organ dysfunction in critically ill patients? a review and a theoretical framework. Crit Care Med. 2000;28:537–49. - PubMed
-
- Zeerleder S, Zwart B, Wuillemin WA, Aarden LA, Groeneveld AB, et al. Elevated nucleosome levels in systemic inflammation and sepsis. Crit Care Med. 2003;31:1947–51. - PubMed
Publication types
MeSH terms
Substances
LinkOut - more resources
Full Text Sources
Other Literature Sources
