. 2011 Aug;48(3):815-39.
doi: 10.1007/s13524-011-0040-5.

Probabilistic projections of the total fertility rate for all countries

Affiliations

Probabilistic projections of the total fertility rate for all countries

Leontine Alkema et al. Demography. 2011 Aug.

Abstract

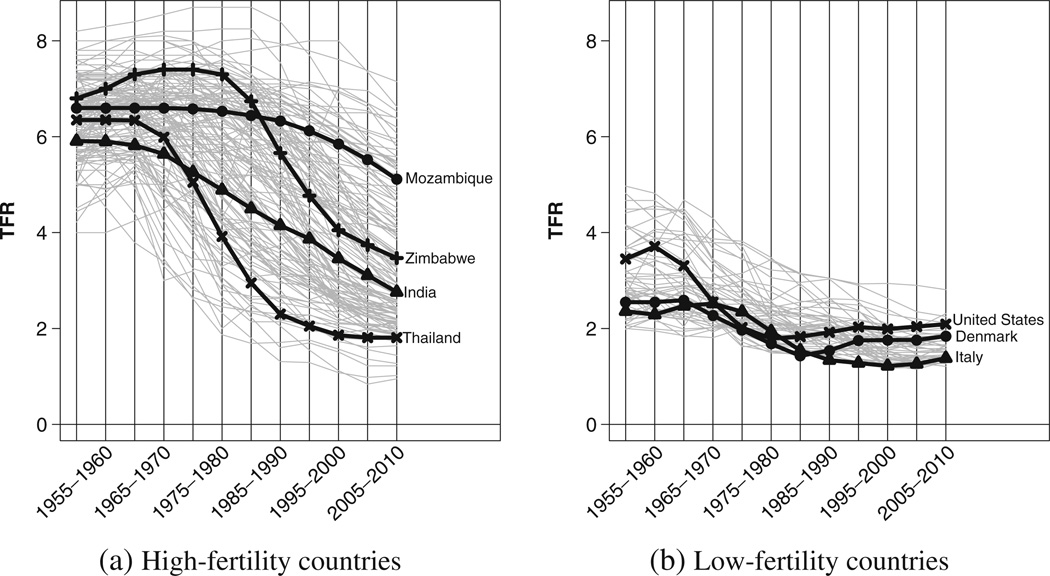
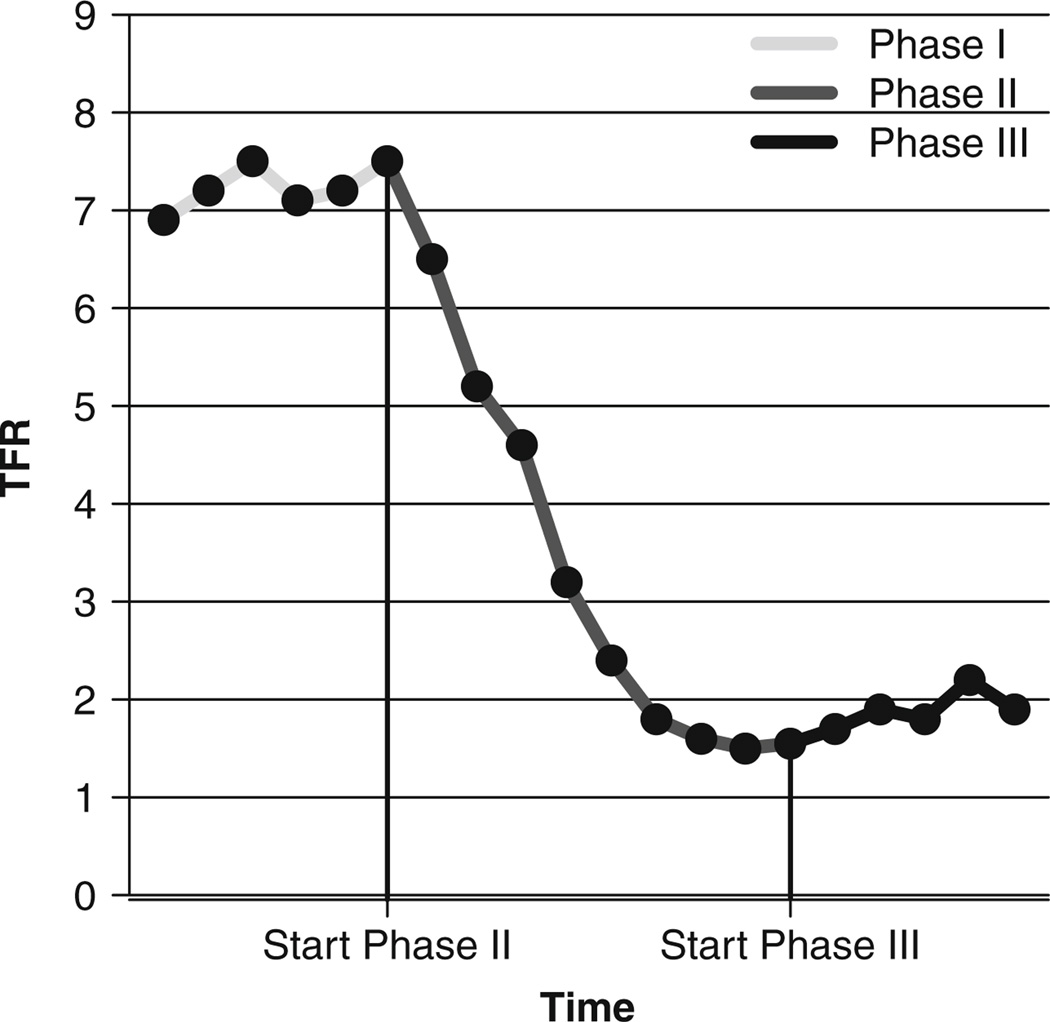
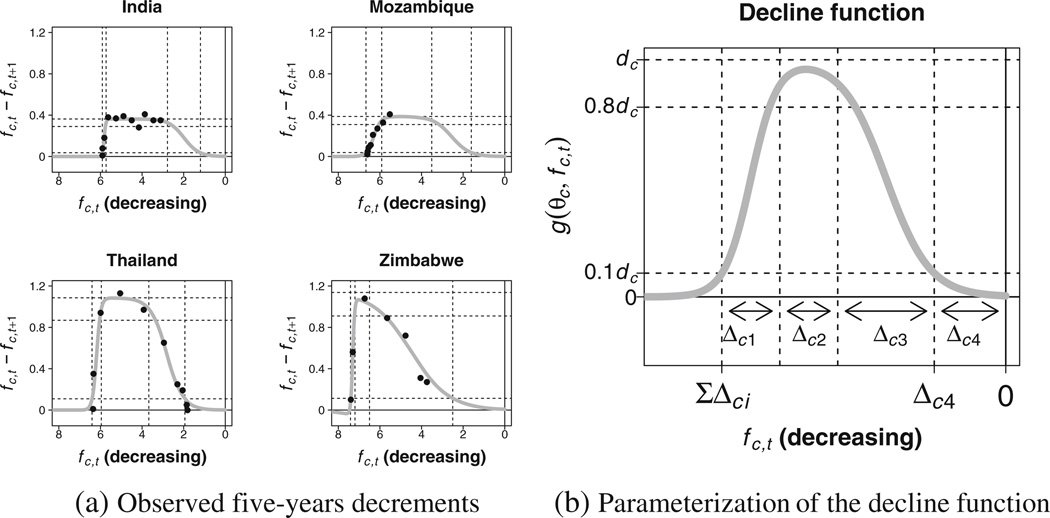
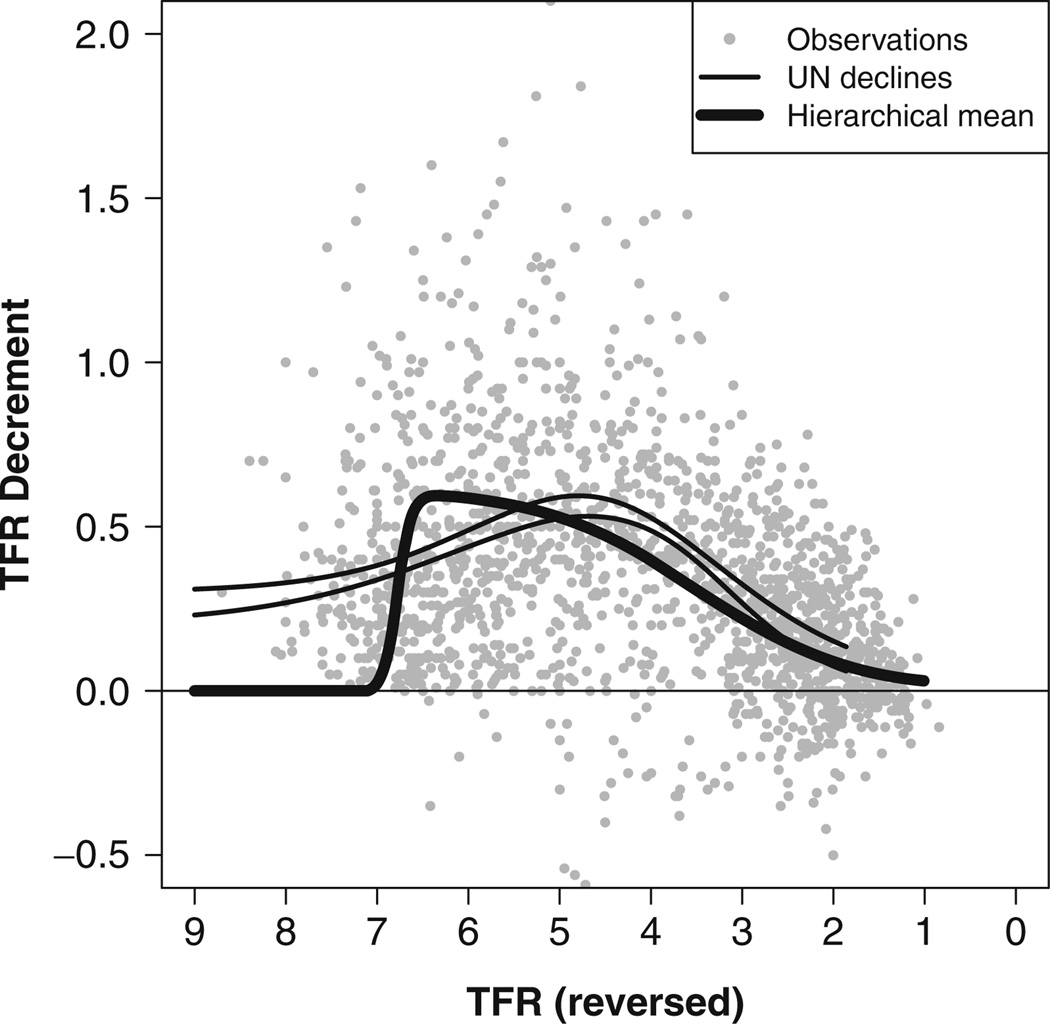
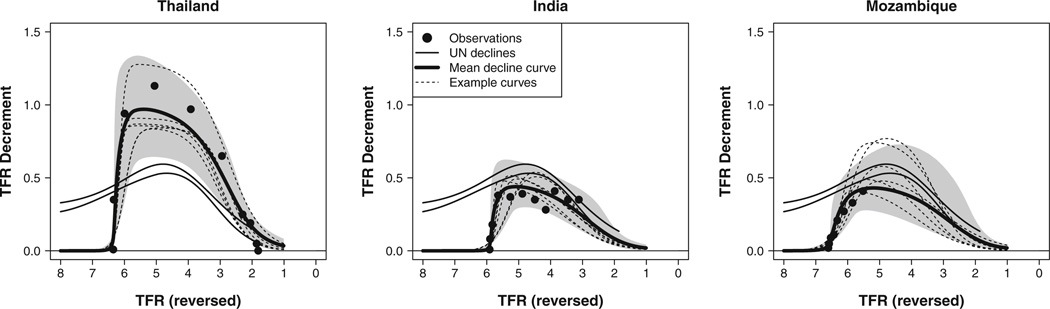
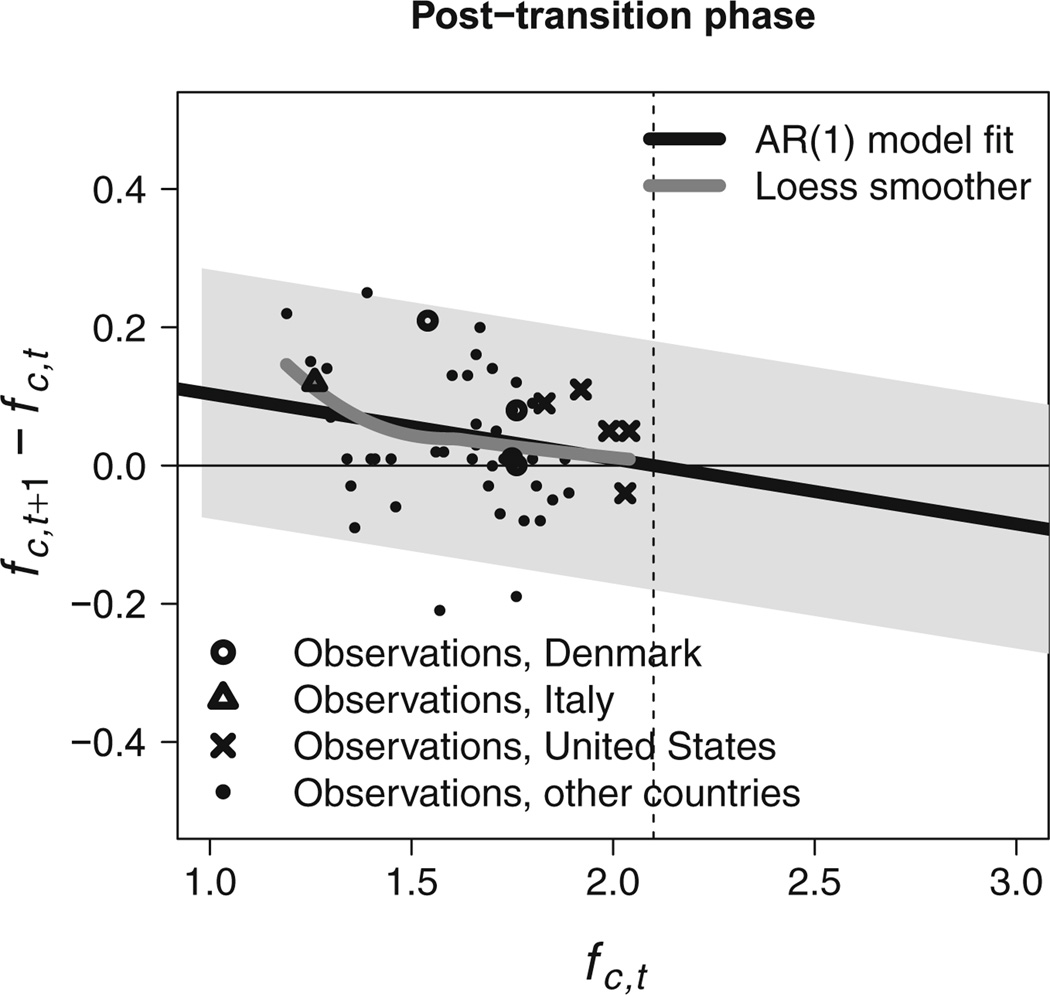
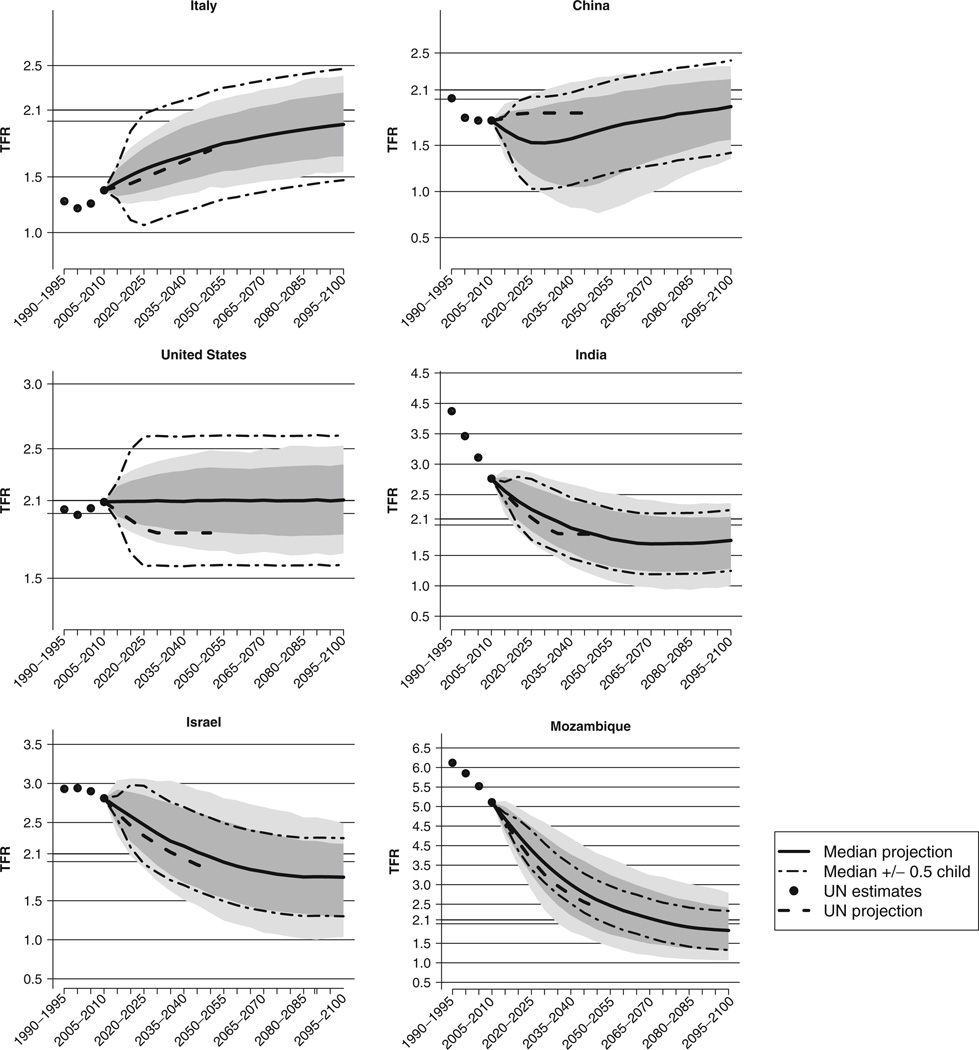
We describe a Bayesian projection model to produce country-specific projections of the total fertility rate (TFR) for all countries. The model decomposes the evolution of TFR into three phases: pre-transition high fertility, the fertility transition, and post-transition low fertility. The model for the fertility decline builds on the United Nations Population Division's current deterministic projection methodology, which assumes that fertility will eventually fall below replacement level. It models the decline in TFR as the sum of two logistic functions that depend on the current TFR level, and a random term. A Bayesian hierarchical model is used to project future TFR based on both the country's TFR history and the pattern of all countries. It is estimated from United Nations estimates of past TFR in all countries using a Markov chain Monte Carlo algorithm. The post-transition low fertility phase is modeled using an autoregressive model, in which long-term TFR projections converge toward and oscillate around replacement level. The method is evaluated using out-of-sample projections for the period since 1980 and the period since 1995, and is found to be well calibrated.


Figures

Fig. 1
Fig. 1
Observed trends in TFR from 1950–1955 until 2005–2010 for (a) high-fertility countries (TFR above 5 during the observation period) and (b) low-fertility countries. Some countries, with TFR series shown in black and named, have been highlighted; the TFR series for the other countries are shown in gray
Fig. 2
Fig. 2
Illustration of the three phases of the evolution of the TFR
Fig. 3
Fig. 3
Modeling the five-year decrements in Phase II during the fertility transition: (a) observed five-year decrements (dots) with least-squares fit of the decline function to the data points, and (b) parameterization of the decline function
Fig. 4
Fig. 4
World (hierarchical) mean of the decline curve, plotted against decreasing TFR. The five-year decrements for all countries during the fertility transition are plotted in gray. The UN fast-fast and slow-slow decline curves are shown by thin lines
Fig. 5
Fig. 5
Decline curves for Thailand, India, and Mozambique plotted against decreasing TFR. Examples of the decline curves simulated from the posterior distribution are shown (dashed lines), together with the mean outcomes of all curves in the posterior sample. The 95% projection intervals for the five-year decrements are represented by the gray area. The observed five-year decrements are shown by black dots, and the fast-fast and slow-slow UN decline curves are shown by thin solid lines
Fig. 6
Fig. 6
Observed changes in TFR in Phase III for Denmark, Italy, the United States, and the other countries in Phase III, together with the AR(1) model fit (black solid line with 95% projection intervals represented by the gray area) and loess smoother fitted to the data points (gray line). The dashed line is drawn at the approximate replacement-level fertility, 2.1
Fig. 7
Fig. 7
Projection intervals for Italy, China, the United States, India, Israel, and Mozambique. The median projection, median projection plus and minus half a child, and the UN estimates and projections (2008 revision) are shown. The 80% projection intervals are represented by the dark gray area, and the 95% projection intervals indicated by the lighter gray area

References

    1. Alders M, Keilman N, Cruijsen H. Assumptions for long-term stochastic population forecasts in 18 European countries. European Journal of Population. 2007;23:33–69. - PMC - PubMed
    1. Alho JM, Alders M, Cruijsen H, Keilman N, Nikander T, Pham DQ. New forecast: Population decline postponed in Europe. Statistical Journal of the United Nations Economic Commission for Europe. 2006;23:1–10.
    1. Alho JM, Jensen SEH, Lassila J. Uncertain demographics and fiscal sustainability. Cambridge, UK: Cambridge University Press; 2008.
    1. Alkema L. Uncertainty assessments of demographic estimates and projections (Doctoral dissertation) University of Washington, Seattle; 2008.
    1. Alkema L, Raftery AE, Gerland P, Clark SJ, Pelletier F. Assessing uncertainty in fertility estimates and projections. Paper presented at the annual meeting of the Population Association of America; New Orleans, LA. 2008a. Apr,

Publication types

LinkOut - more resources