

Chromosomes 4 and 8 implicated in a genome wide SNP linkage scan of 762 prostate cancer families collected by the ICPCG
- PMID: 21748754
- PMCID: PMC3568777
- DOI: 10.1002/pros.21443
Chromosomes 4 and 8 implicated in a genome wide SNP linkage scan of 762 prostate cancer families collected by the ICPCG
Abstract
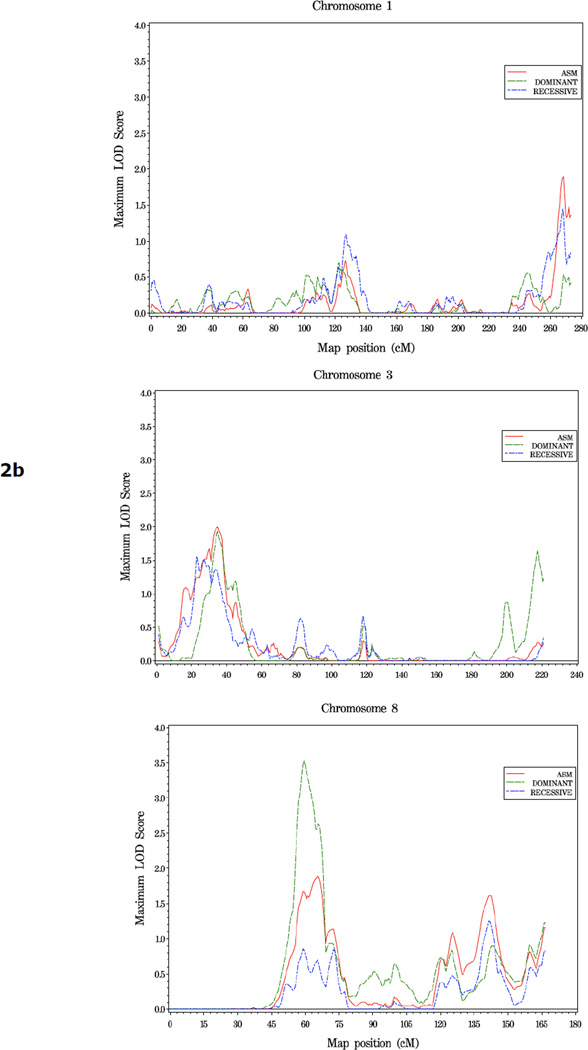
Background: In spite of intensive efforts, understanding of the genetic aspects of familial prostate cancer (PC) remains largely incomplete. In a previous microsatellite-based linkage scan of 1,233 PC families, we identified suggestive evidence for linkage (i.e., LOD ≥ 1.86) at 5q12, 15q11, 17q21, 22q12, and two loci on 8p, with additional regions implicated in subsets of families defined by age at diagnosis, disease aggressiveness, or number of affected members.
Methods: In an attempt to replicate these findings and increase linkage resolution, we used the Illumina 6000 SNP linkage panel to perform a genome-wide linkage scan of an independent set of 762 multiplex PC families, collected by 11 International Consortium for Prostate Cancer Genetics (ICPCG) groups.
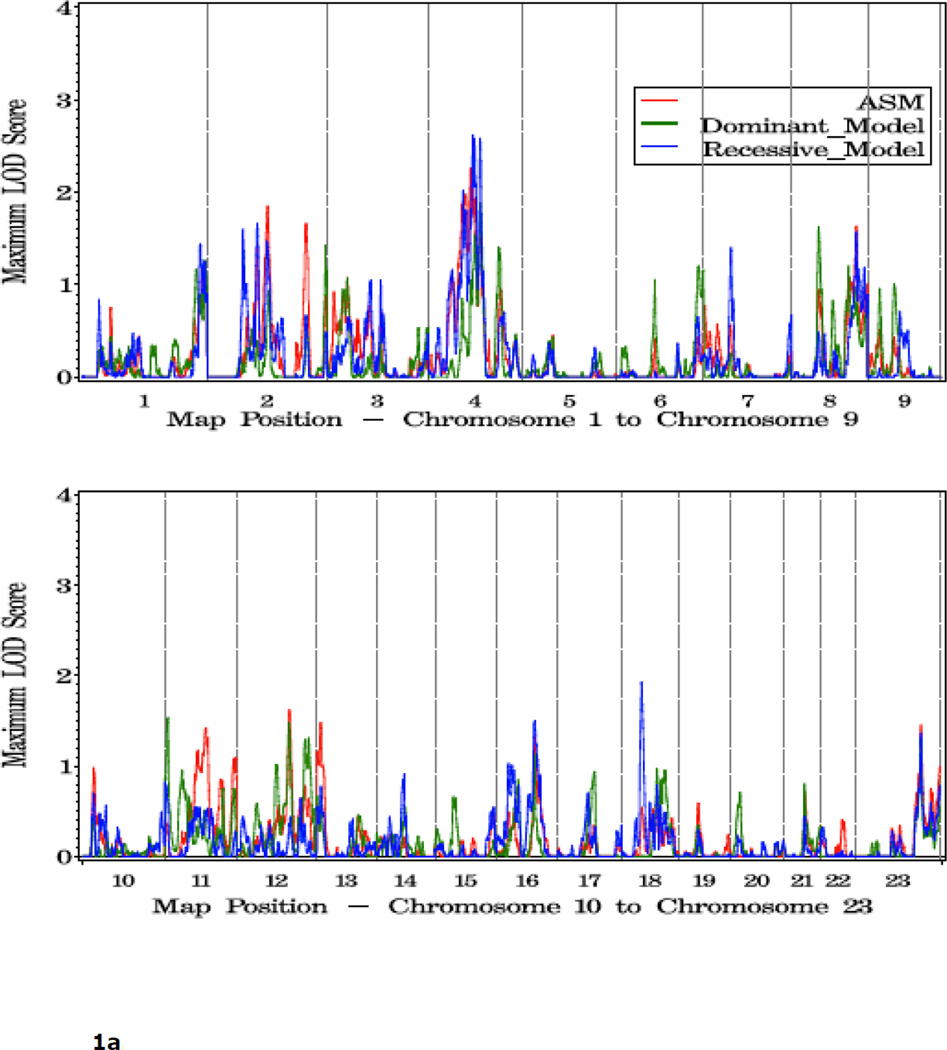
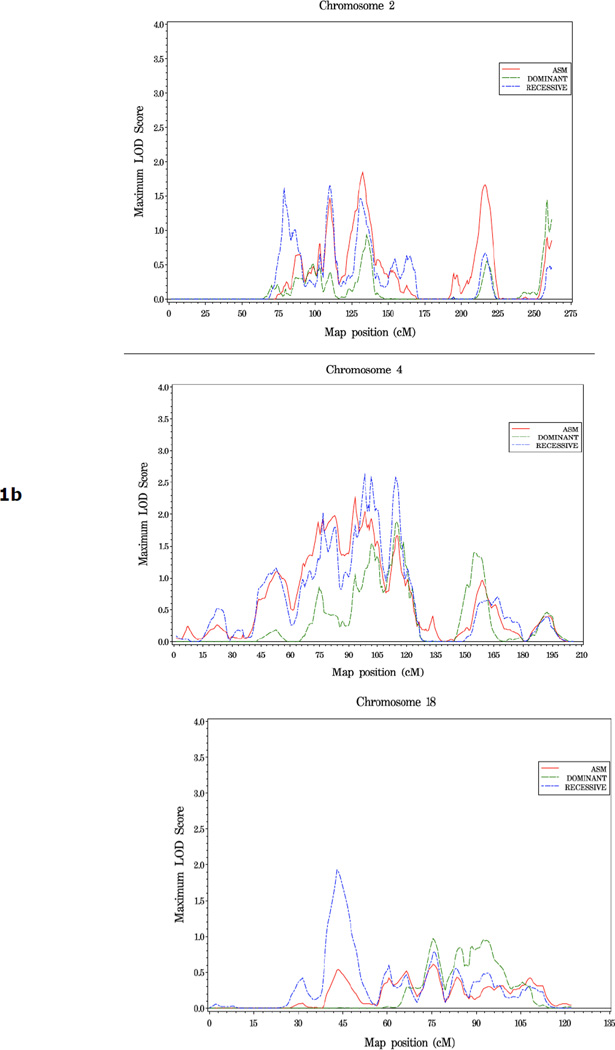
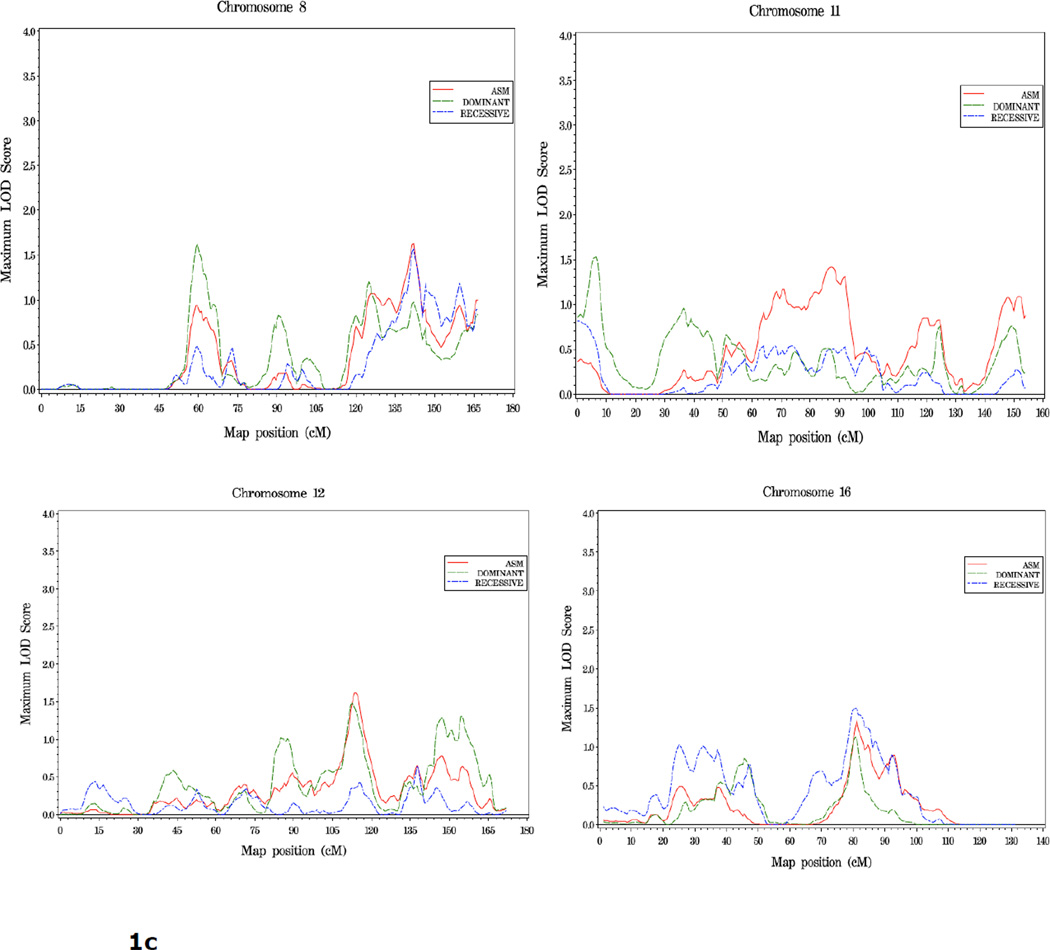
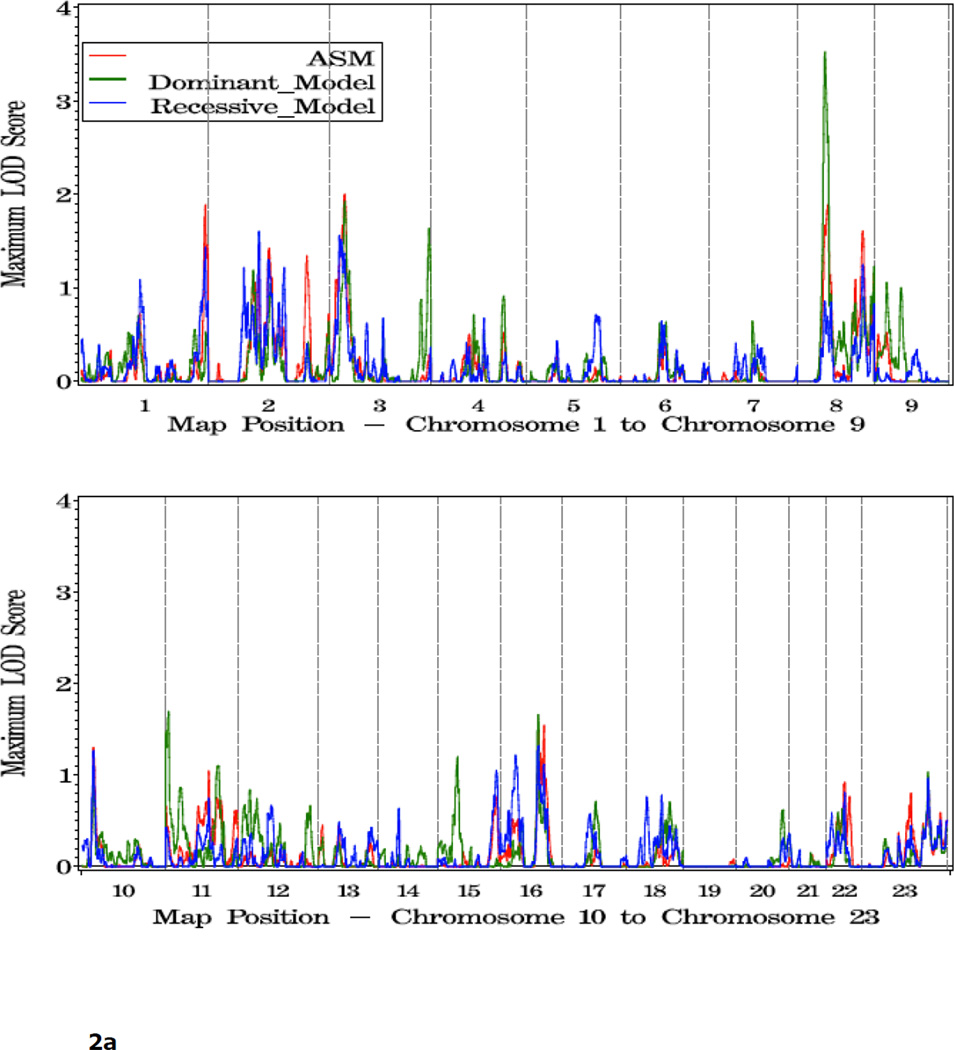
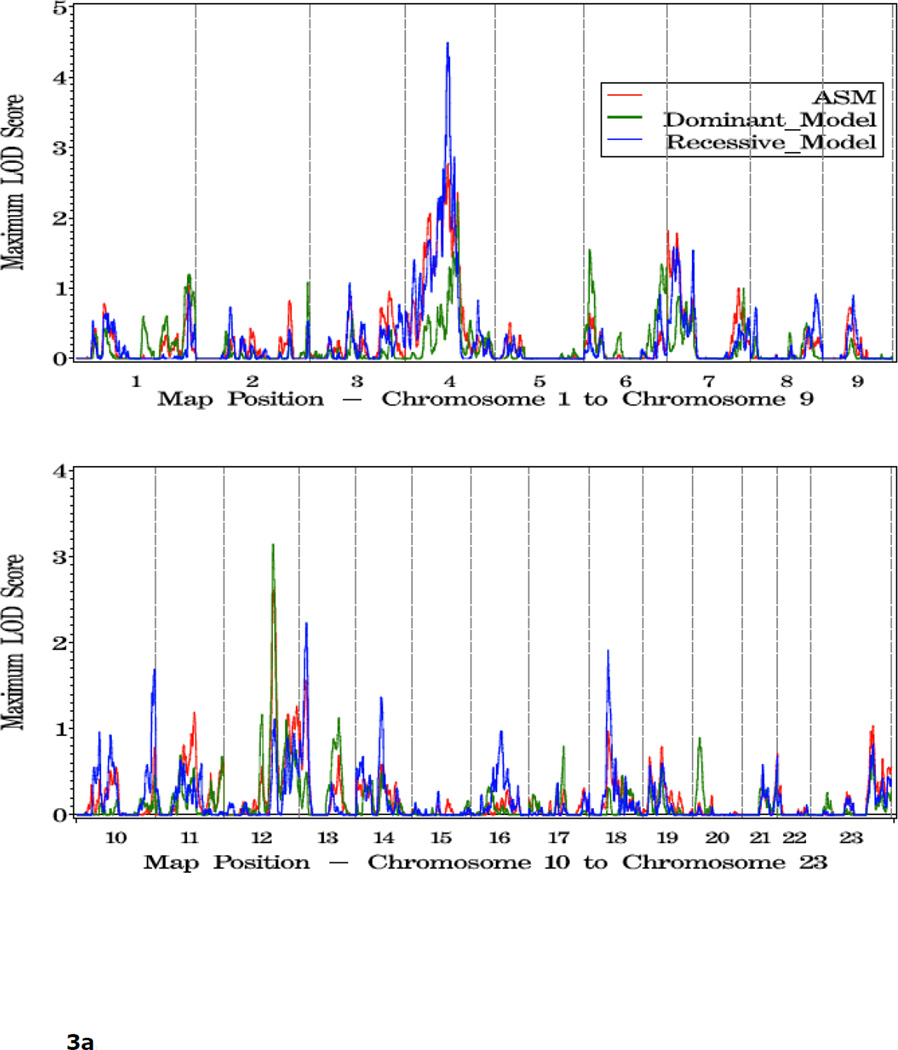
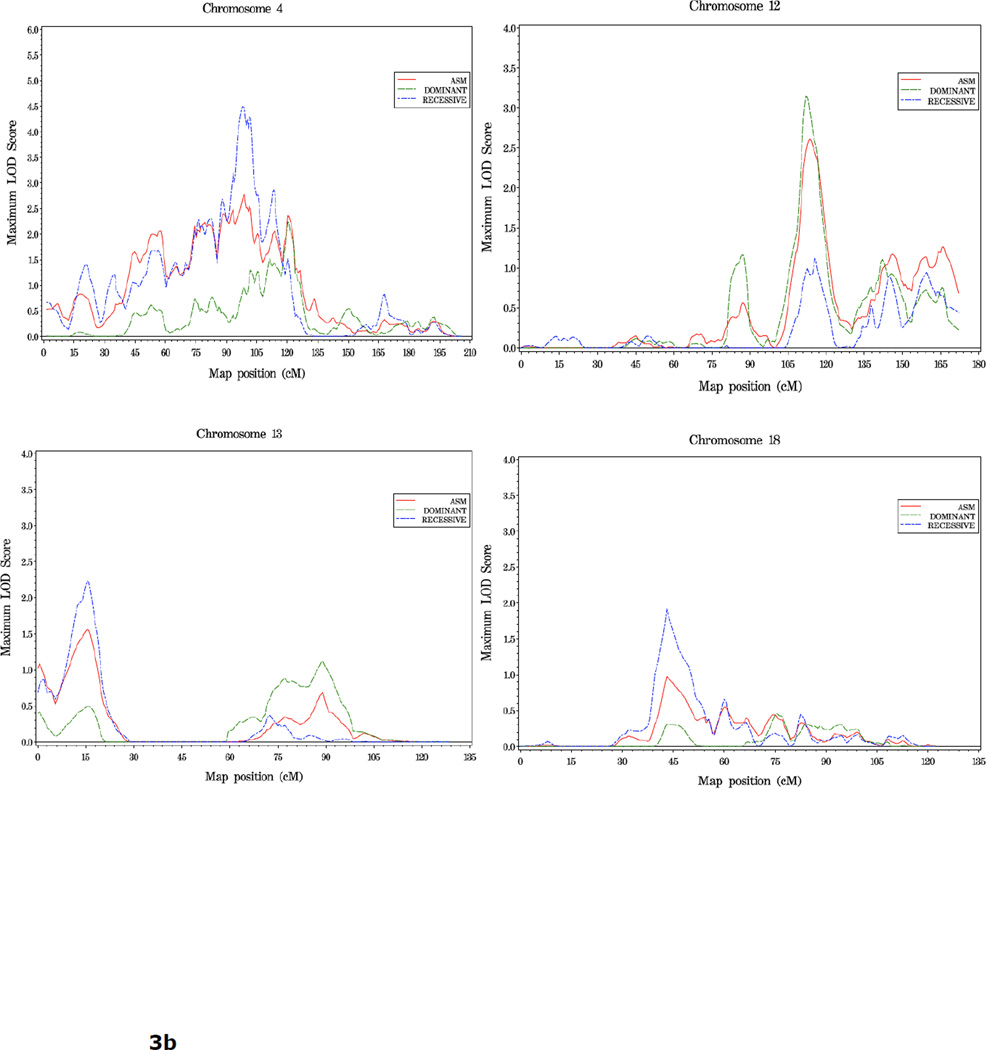
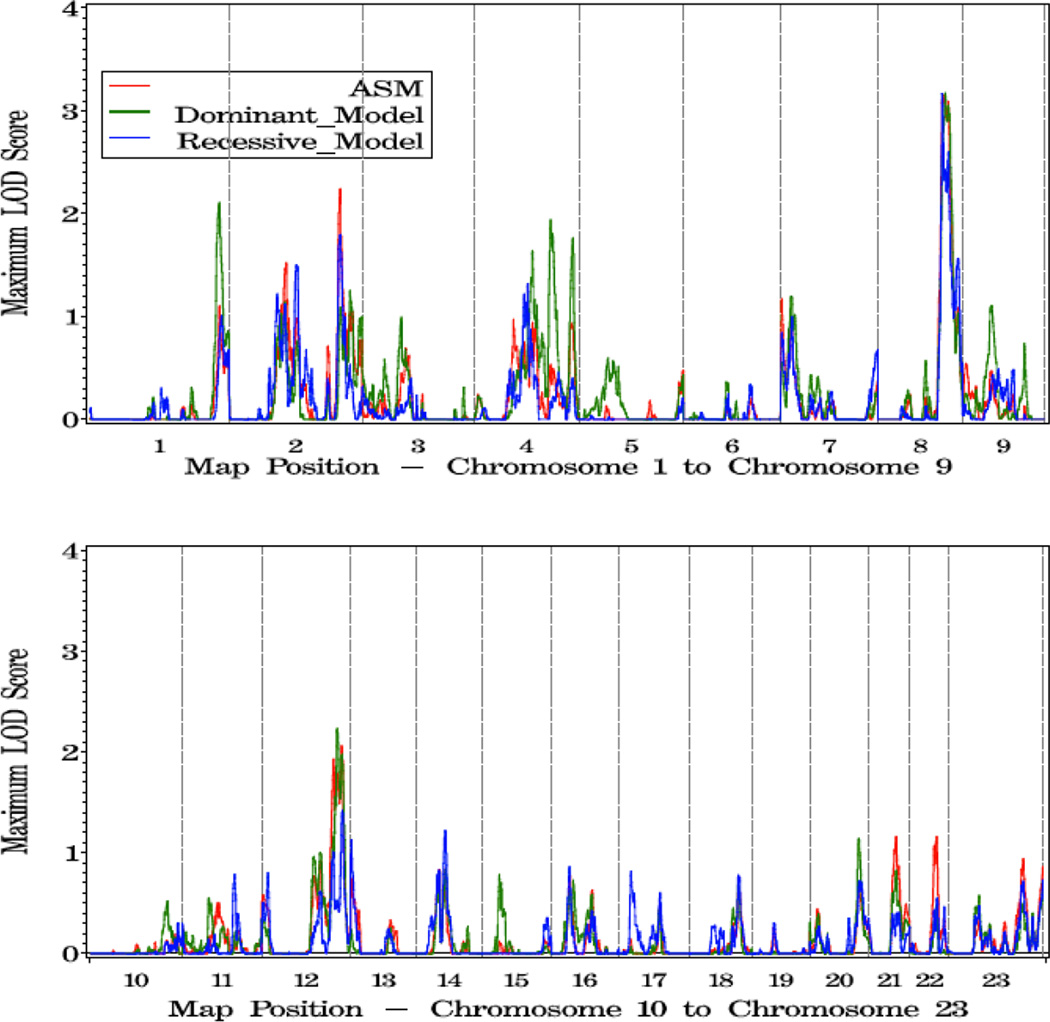
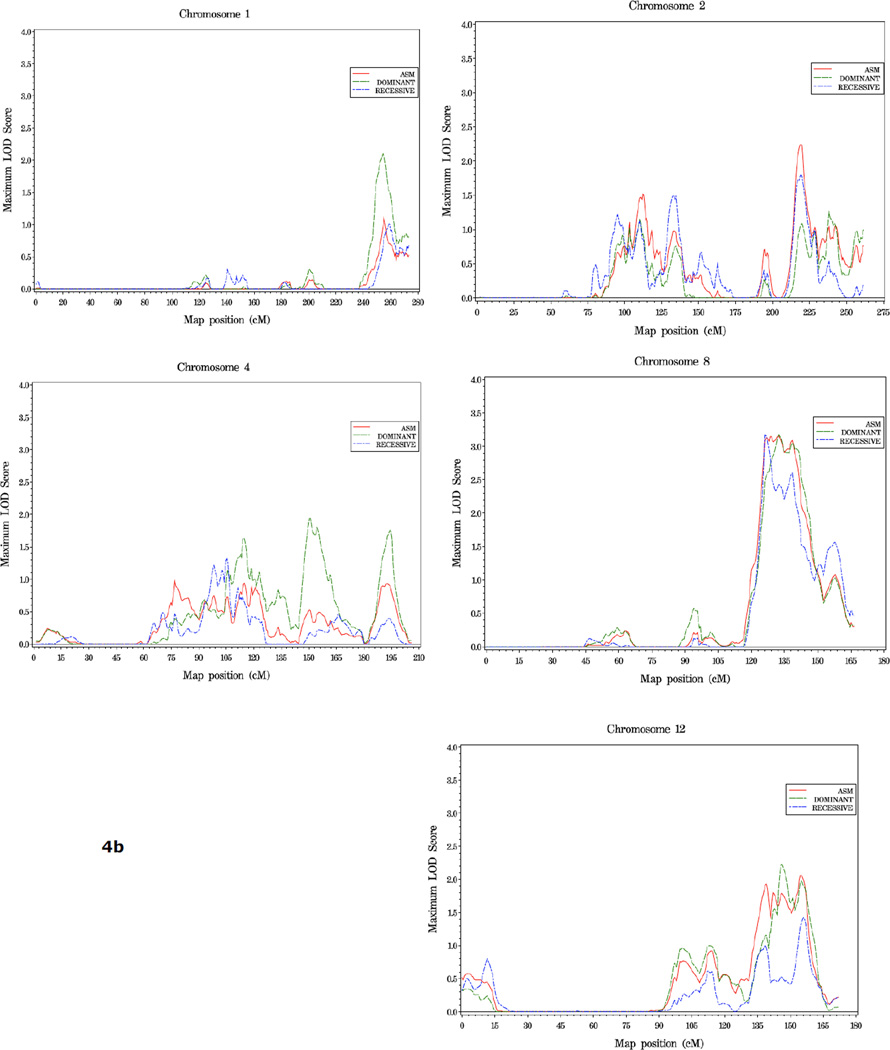
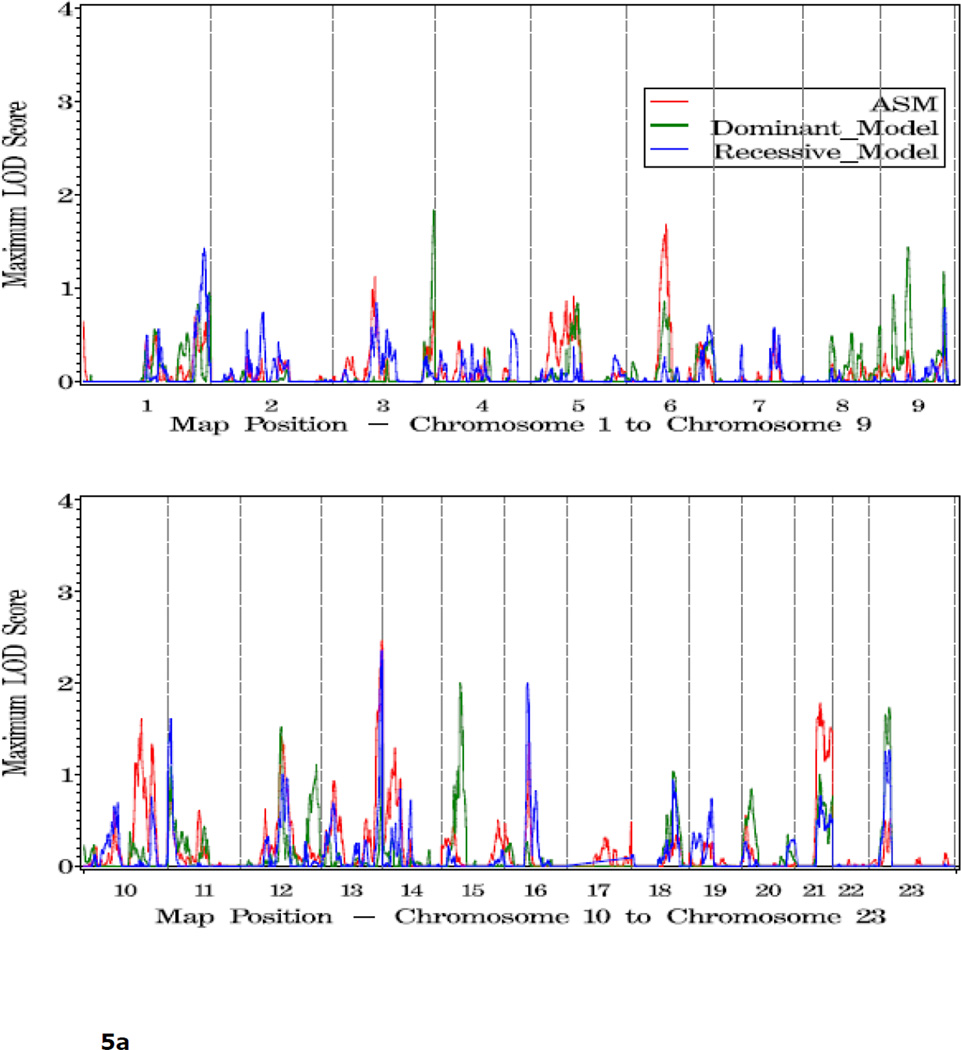
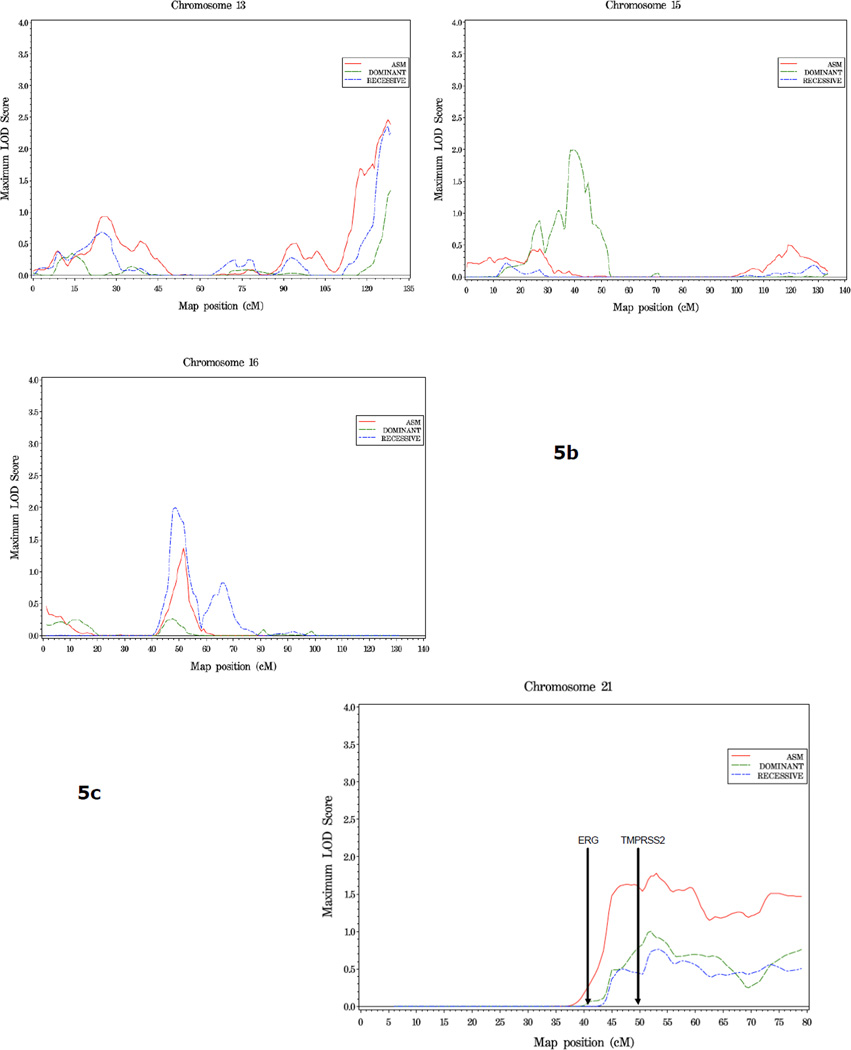
Results: Of the regions identified previously, modest evidence of replication was observed only on the short arm of chromosome 8, where HLOD scores of 1.63 and 3.60 were observed in the complete set of families and families with young average age at diagnosis, respectively. The most significant linkage signals found in the complete set of families were observed across a broad, 37 cM interval on 4q13-25, with LOD scores ranging from 2.02 to 2.62, increasing to 4.50 in families with older average age at diagnosis. In families with multiple cases presenting with more aggressive disease, LOD scores over 3.0 were observed at 8q24 in the vicinity of previously identified common PC risk variants, as well as MYC, an important gene in PC biology.
Conclusions: These results will be useful in prioritizing future susceptibility gene discovery efforts in this common cancer.
Copyright © 2011 Wiley Periodicals, Inc.
Figures
References
-
- Easton DF, Eeles RA. Genome-wide association studies in cancer. Hum Mol Genet. 2008;17(R2):R109–R115. - PubMed
-
- Bruner DW, Moore D, Parlanti A, Dorgan J, Engstrom P. Relative risk of prostate cancer for men with affected relatives: systematic review and meta-analysis. Int J Cancer. 2003;107(5):797–803. - PubMed
-
- Johns LE, Houlston RS. A systematic review and meta-analysis of familial prostate cancer risk. BJU Int. 2003 Jun;91(9):789–794. 2003. - PubMed
-
- Easton DF, Schaid DJ, Whittemore AS, Isaacs WB. International Consortium for Prostate Cancer Genetics. Where are the prostate cancer genes?--A summary of eight genome wide searches. Prostate. 2003;D57(4):261–269. - PubMed
-
- Schaid DJ. The complex genetic epidemiology of prostate cancer. Hum Mol Genet. 2004;13:R103–R121. - PubMed
Publication types
MeSH terms
Supplementary concepts
Grants and funding
- CA78836/CA/NCI NIH HHS/United States
- R01 CA078836/CA/NCI NIH HHS/United States
- CA079596/CA/NCI NIH HHS/United States
- 10588/CRUK_/Cancer Research UK/United Kingdom
- CA90752/CA/NCI NIH HHS/United States
- 11022/CRUK_/Cancer Research UK/United Kingdom
- CA58236/CA/NCI NIH HHS/United States
- R01 CA072818/CA/NCI NIH HHS/United States
- U01 CA89600/CA/NCI NIH HHS/United States
- ImNIH/Intramural NIH HHS/United States
- CA98364/CA/NCI NIH HHS/United States
- CA95052/CA/NCI NIH HHS/United States
- N01 PC035141/CA/NCI NIH HHS/United States
- R01 CA080122/CA/NCI NIH HHS/United States
- R01 CA106523/CA/NCI NIH HHS/United States
- R01 CA090752/CA/NCI NIH HHS/United States
- P50 CA058236/CA/NCI NIH HHS/United States
- P30 CA015704/CA/NCI NIH HHS/United States
- N01-PC-35141/PC/NCI NIH HHS/United States
- R01 CA095052/CA/NCI NIH HHS/United States
- T15 LM007124/LM/NLM NIH HHS/United States
- UL1 RR025741/RR/NCRR NIH HHS/United States
- U01 CA089600/CA/NCI NIH HHS/United States
- C5047/A3354/CRUK_/Cancer Research UK/United Kingdom
- U01 CA067044/CA/NCI NIH HHS/United States
- CA80122/CA/NCI NIH HHS/United States
- CA72818/CA/NCI NIH HHS/United States
- 15007/CRUK_/Cancer Research UK/United Kingdom
- CA67044/CA/NCI NIH HHS/United States
- K07 CA098364/CA/NCI NIH HHS/United States
- R01 CA079596/CA/NCI NIH HHS/United States
- CA106523/CA/NCI NIH HHS/United States
- 10118/CRUK_/Cancer Research UK/United Kingdom
- R01 CA067044/CA/NCI NIH HHS/United States
- P30 CA042014/CA/NCI NIH HHS/United States
LinkOut - more resources
Full Text Sources
Other Literature Sources
Medical
Molecular Biology Databases
