

doi: 10.1021/ja204997c.
Epub 2011 Jul 12.
Phosphorescent sensor for robust quantification of copper(II) ion
Affiliations
- PMID: 21749087
- PMCID: PMC3145029
- DOI: 10.1021/ja204997c
Item in Clipboard
Phosphorescent sensor for robust quantification of copper(II) ion
J Am Chem Soc.
.
Abstract
A phosphorescent sensor based on a multichromophoric iridium(III) complex was synthesized and characterized. The construct exhibits concomitant changes in its phosphorescence intensity ratio and phosphorescence lifetime in response to copper(II) ion. The sensor, which is reversible and selective, is able to quantify copper(II) ions in aqueous media, and it detects intracellular copper ratiometrically.
Figures
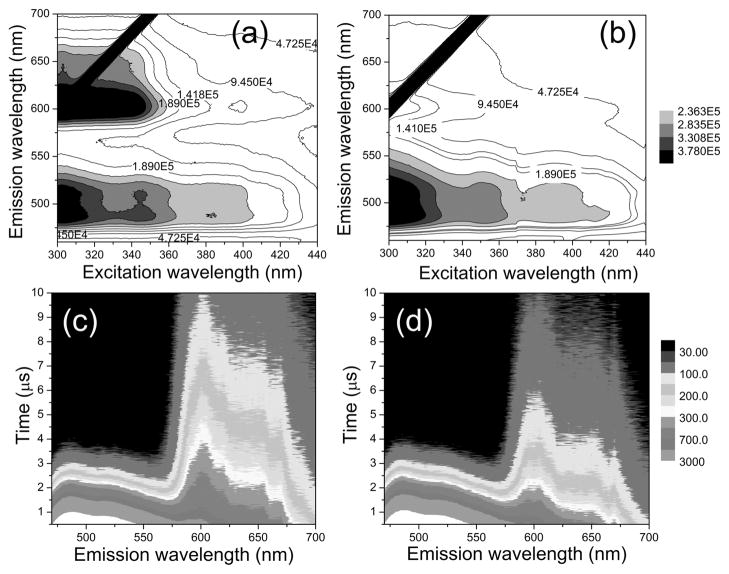
Steady-state phosphorescence spectrum of ZIr2 in the absence (a) and presence (b) of CuCl2. Time-resolved phosphorescence spectrum of ZIr2 in the absence (c) and presence (d) of CuCl2 (λex = 342 nm). Conditions: 10 μM ZIr2 for steady-state spectra and 20 μM ZIr2 for time-resolved spectra in pH 7.0 buffer (25 mM PIPES containing <2 vol % of DMSO). Black diagonal lines in (a) and (b) are harmonics of the excitation beam.
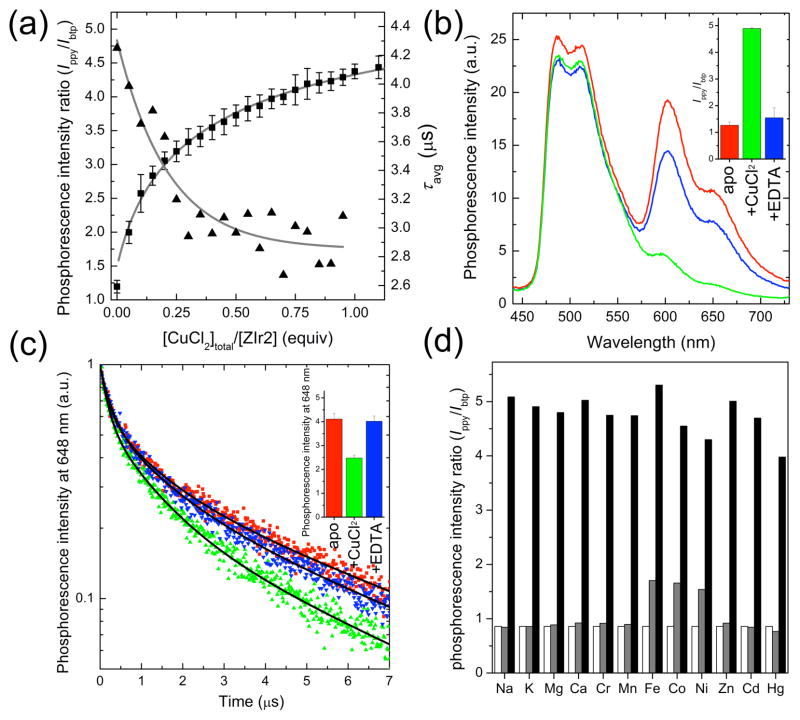
(a) Phosphorescence titration (squares for phosphorescence intensity ratio (Ippy/Ibtp) and triangles for average phosphorescence lifetime (τavg) of ZIr2 with the addition of CuCl2. See Figures S3 and S5 in Supporting Information for the raw data. (b) Reversible change in phosphorescence spectrum of ZIr2 in response to CuCl2 (red line, Cu(II)-free state; green line, in the presence of CuCl2 (1 equiv); blue line, after subsequent addition of Na2EDTA (100 equiv) to the mixture). The inset depicts the corresponding change in phosphorescence intensity ratio of green (470–570 nm) vs red (580–700 nm) bands. (c) Reversible change in the phosphorescence decay trace of ZIr2 in response to CuCl2 (red symbols, Cu(II)-free state; green symbols, in the presence of CuCl2 (1 equiv); blue symbols, after subsequent addition of Na2EDTA (200 equiv) to the mixture). Black solid lines are fits based on a triple exponential decay model. The inset depicts the corresponding change in the average phosphorescence lifetime. (d) Cu(II) ion selectivity of ZIr2 (white bar, metal-free state; grey bar, in the presence of metal salt (100 equiv for Na+, Mg2+, Ca2+; 10 equiv for Zn2+; 1 equiv for others); black bar, after subsequent addition of CuCl2 (1 equiv)). Conditions: 10 μM ZIr2 for steady-state measurements and 20 μM ZIr2 for time-resolved measurements in pH 7.0 buffer (25 mM PIPES containing <2 vol % of DMSO).
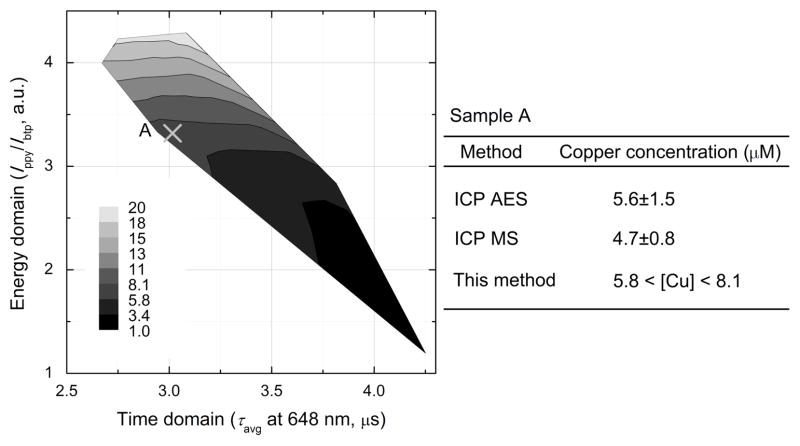
Contour map showing copper concentration as a function of phosphorescence intensity ratio (Ippy/Ibtp) and average phosphorescence lifetime (τavg) of ZIr2. Also depicted is the quantitation of copper in sample A using the phosphorescence signals. At the right is a comparison of values determined by ICP AES, ICP MS, and the present method.
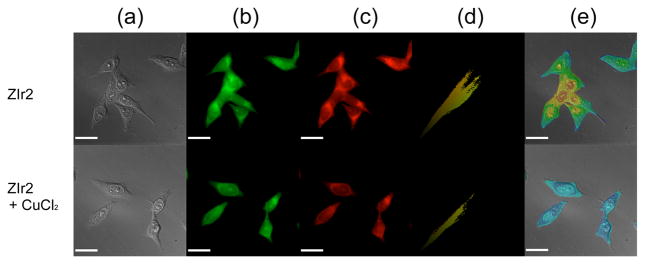
Intracellular copper imaging of fixed HeLa cells treated with 10 μM ZIr2. Cells in the lower panels were incubated with 500 μM CuCl2 prior to ZIr2 treatment. (a) Differential interference contrast images. (b) Phosphorescence acquired through a green channel (excitation band path = 300–390 nm, emission band path = 510–560 nm). (c) Phosphorescence acquired through a red channel (excitation band path = 400–450 nm, emission cut-on for >600 nm). (d) Colocalization scatter plot of green and red channels. (e) Phosphorescence intensity ratio images of green and red channels. Scale bar corresponds to 25 μm, and an identical scale for color mapping was applied to images (e). See Figure S16 in SI for an enlarged version.
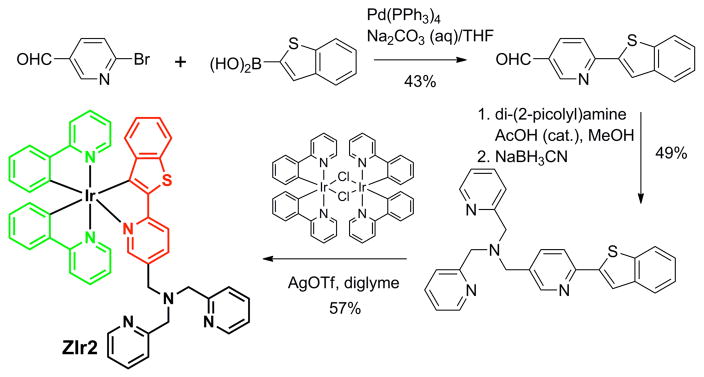
Synthesis and Structure of the Copper(II) Sensor ZIr2
References
Publication types
MeSH terms
Substances
Grants and funding
LinkOut - more resources
Full Text Sources
Other Literature Sources
