. 2011 Oct 1;58(3):749-60.
doi: 10.1016/j.neuroimage.2011.06.062. Epub 2011 Jul 1.

Same-session functional assessment of rat retina and brain with manganese-enhanced MRI

Affiliations

Same-session functional assessment of rat retina and brain with manganese-enhanced MRI

David Bissig et al. Neuroimage. .

Abstract

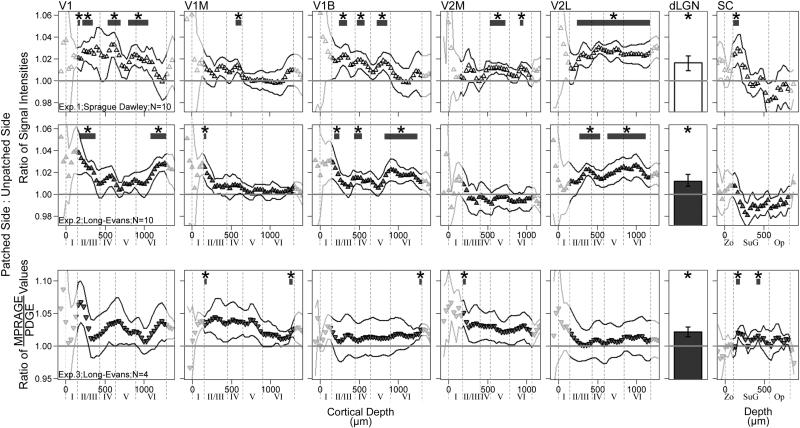
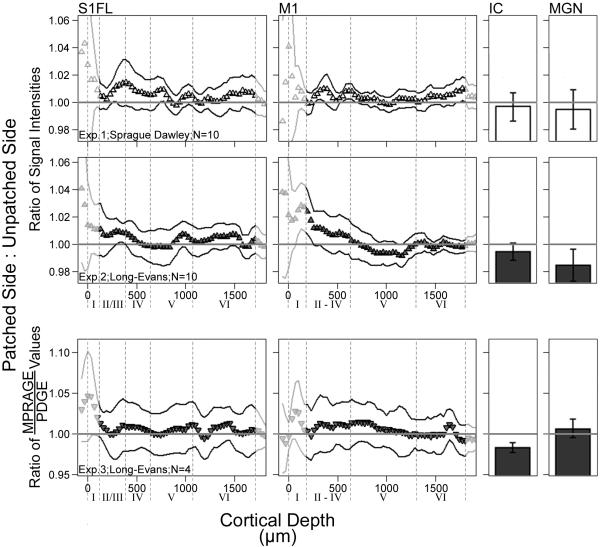
Manganese-enhanced MRI (MEMRI) is a powerful non-invasive approach for objectively measuring either retina or binocular visual brain activity in vivo. In this study, we investigated the sensitivity of MEMRI to monocular stimulation using a new protocol for providing within-subject functional comparisons in the retina and brain in the same scanning session. Adult Sprague Dawley or Long-Evans rats had one eye covered with an opaque patch. After intraperitoneal Mn(2+) administration on the following day, rats underwent visual stimulation for 8h. Animals were then anesthetized, and the brain and each eye examined by MEMRI. Function was assessed through pairwise comparisons of the patched (dark-adapted) versus unpatched (light-exposed) eyes, and of differentially-stimulated brain structures - the dorsal lateral geniculate nucleus, superior colliculus, and visual cortical regions - contralateral to the patched versus unpatched eye. As expected, Mn(2+) uptake was greater in the outer retina of dark-adapted, relative to light-exposed, eyes (P<0.05). Contralateral to the unpatched eye, significantly more Mn(2+) uptake was found throughout the visual brain regions than in the corresponding structures contralateral to the patched eye (P<0.05). Notably, this regional pattern of activity corresponded well to previous work with monocular stimulation. No stimulation-dependent differences in Mn(2+) uptake were observed in negative control brain regions (P>0.05). Post-hoc assessment of functional data by animal age and strain revealed no significant effects. These results demonstrate, for the first time, the acquisition of functional MRI data from the eye and visual brain regions in a single scanning session.


Figures

Fig. 1
Fig. 1
Data analysis for the retina, shown for a representative image of the eye before (A) and after (B) digital linearization of the retina (white bars and arrow provide orientation between A and B). After linearization, retinal extents – the distance from the optic nerve head to ora serrata – are measured for the superior and inferior retina. After binning retinal data in 10% increments of retinal extent (10 bins per hemiretina), mean retinal layer-specific signal intensities are found within each bin (C). Expressing the mean data for each bin as a profile of signal as a function of distance from the (provisional) retina/vitreous border (D), the retina/vitreous and retina/choroid borders are found by the half-height method (D; gray vertical lines). These borders are used to calculate retinal thickness for each bin, to estimate retinal volume (G–H), and to organize binned data as a function distance from the retina/vitreous border by % of whole-retinal thickness (E). Finally, data from the superior and inferior retina – signal intensities, as well as retinal extents and bin-specific thicknesses – are averaged for later analysis (F). For each hemiretina, a polynomial along the retina/choroid border is found after re-mapping retinal thickness data on to the original image. Polynomials for the retinal borders, shown for the superior retina in G, are integrated about central axis of the eye (H) to estimate retinal surface area and volume for each hemiretina. Note that greater signal intensities from the central towards the peripheral retina are primarily caused by the closer proximity of peripheral retina to the surface coil. Functional comparisons are restricted to the central retina (10–30% extent) in the present work.
Fig. 2
Fig. 2
Representative images of the patched (right column) and unpatched eye from three animals. Images from Exps. 1 and 2 share the same scale bars (mm, and grays in muscle-normalized units). Grayscale images from Exp. 3 – shown for two of eight available TRs – share the same arbitrary linear units of signal intensity. 1/T1 maps are shown in color, in units of inverse seconds, with water-poor areas (lens center and background) masked in black. Below, the central retina (10 to 30% extent; arrows to arrowheads) of both eyes is enlarged to show contrasting patterns of inner retina, which is similar in both eyes, and outer retina, which shows lower values (blues and greens) in the unpatched than in the patched eye. A rim of high 1/T1 values (~2.25 s−1) is visible for pixels on the border of retina with choroid (and sclera), and is an artifact of partial-volume averaging. In the analysis of central retinal function, this rim of artifact is in the excluded portion of profiles (90 to 100% depth). The artifact is exaggerated in far-peripheral retina – which is omitted from the present analyses of function – where the retina is thinnest, and image resolution perpendicular to the retinal surface is relatively low. Analysis of the iris and fine structure of the ciliary body are also susceptible to partial-volume artifacts at the present resolution, and these tissues were not evaluated in this study. In grayscale images, the higher signal intensities in the peripheral versus central retina (and adjacent vitreous) are influenced by coil proximity, as is the signal variability in far-peripheral superior (image left) versus inferior (image right) retina. These signal intensity gradients are less steep in the central retina (10–30% extent), and their influence in analysis of central retinal function is further diminished by averaging superior and inferior retina. These signal gradients are removed when calculating 1/T1. Slight distortions in shape of the eye arise when the proptosed eye fits poorly within the surface coil, are most visible for the larger eyes of Exp. 1 rats (see Supplemental Fig. 1), but are unlikely to influence results: Mn2+ uptake reflects neuronal activity in the conscious animal prior to scanning, as evidenced by the presence of light/dark differences hours after monocular light exposure (Fig. 4), and previous tests in our lab that found no difference in Mn2+ uptake measurements from retinas of living versus recently-euthanized rats (unpublished data). As noted in the main text, formal calculation of retinal T1 always followed linearization, alignment to the vitreoretinal border, and spatial normalization — the 1/T1 maps shown here are for display purposes only. Brain images from the same three animals are shown in Fig. 3.
Fig. 3
Fig. 3
Representative brain images from three animals, both before (gray) and after (color) signal correction for distance from surface coil. The patched side of each is shown on the right side of each slice. Brain regions of interest are labeled on Exp. 2’s raw images (see main text for abbreviations). SC is marked with three lines per hemisphere, representing the sampling method at that structure. Raw images use a linear gray scale of arbitrary signal units to show structural detail, while color images use a linear scale with a narrower range (scales at far left, ranging roughly ±50% and ±25% of the middle value for the gray and color scales, respectively). The narrower color range is applied to better-visualize stimulation-dependent Mn2+ uptake that, averaging across several slices and animals, typically amounts to a 2–3% difference in brain signal intensity (Fig. 5). As pictured, intensity comparisons are only meaningful within a series of slices from a single brain image, which are arranged from caudal (figure left) to rostral (figure right) and roughly correspond to bregma −8.8, −6.2, −4.7, and 0.4 mm (Paxinos and Watson, 2007). Negative control regions show symmetrical Mn2+ uptake throughout. In contrast, the dLGN, superficial SC, and portions of the visual cortex show consistently higher Mn2+ uptake on the patched side of the animal, which mainly receives information from the unpatched, visually-stimulated, eye. The ratio method employed for Exp. 3 results in improved white versus gray matter contrast, but this can complicate visual inspection of Mn2+ levels. For instance, the superficial SC clearly has greater signal intensity on the patched than unpatched side in the MPRAGE image, but is symmetrical in the PDGE image, yielding a difference in MPRAGE/PDGE ratio consistent with expectations. This narrow band of differential uptake in the superficial gray of the SC is difficult to see in the ratio image near deeper, heavily-myelinated, midbrain structures. The mm scale at the lower-left applies throughout. Eye images from the same three animals are shown in Fig. 2.
Fig. 4
Fig. 4
Layer-specific analysis of central (10 to 30% extent) retinal function in all three experiments. Normalized signal intensity (Exps. 1 and 2) and 1/T1 (Exp. 3) ratios of the patched (dark-adapted) eye to those of the unpatched (light-exposed) eye are shown. A ratio of 1.0 (horizontal line) indicates identical Mn2+ uptake in patched and unpatched eyes, while a ratio grater than 1.0 indicates greater Mn2+ uptake in the patched eye. Data are shown as a function of distance from the retina/non-retina borders, where 0 is the vitreous/retina border and 100 is the retina/choroid border. Note that the outermost retinal data (near 100%) likely includes some signal from the choroid due to partial volume averaging and other factors (Berkowitz et al., 2007a). Effect size estimates are provided for both inner and outer retina in Table 1, aiding the interpretation of the higher ratio means and variability seen in Exp. 3 (see scale). For those areas tested (from 10% to 90% of the retinal thickness), * indicates significantly greater Mn2+ uptake in patched eyes (P<0.05; paired one-tailed t-tests) at the noted depths (thick horizontal bars). Solid profile lines denote±s.e.m of ratio data.
Fig. 5
Fig. 5
Layer-specific analysis of brain function in visual brain regions for all three experiments. Normalized signal intensity (Exps. 1 and 2) and MPRAGE/PDGE (Exp. 3) ratios of visually-stimulated brain – ipsilateral to the patch – to unstimulated brain (on the unpatched side of the head). A ratio of 1.0 (horizontal line) indicates identical Mn2+ uptake on each side, while a ratio grater than 1.0 indicates greater Mn2+ uptake in the visually-stimulated hemisphere of the brain. Profile data are shown as a function of distance from the brain/non-brain border (Cortical Depth=0). To aid in interpretation, provisional borders of cortical layers are shown (dashed lines) based on previous literature (see text). Effect size estimates are provided for all tested layers with significant weighted z-transform results in Table 1, aiding the interpretation of the higher ratio means and variability seen in Exp. 3 (see scale). For those areas tested (dLGN and undimmed portions of the profiles), * indicates significantly greater Mn2+ uptake on the visually-stimulated side of the brain (P<0.05; paired one-tailed t-tests). Solid profile lines denote±s.e.m of ratio data. Superior colliculus (SC) abbreviations: Zo — zonal layer; SuG — superficial gray; Op — optic nerve layer.
Fig. 6
Fig. 6
Negative-control brain regions for all three experiments. Normalized signal intensity (Exps. 1 and 2) and MPRAGE/PDGE (Exp. 3) ratios of visually-stimulated brain – ipsilateral to the patch – to unstimulated brain (on the unpatched side of the head). A ratio of 1.0 (horizontal line) indicates identical Mn2+ uptake on each side, while a ratio grater than 1.0 indicates greater Mn2+ uptake in the visually-stimulated hemisphere of the brain. Profile data are shown as a function of distance from the brain/non-brain border (Cortical Depth=0). To aid in interpretation, provisional borders of cortical layers are shown (dashed lines) based on previous literature (see text). Effect size estimates are provided for all tested layers with significant weighted z-transform results in Table 1, aiding the interpretation of the higher ratio means and variability seen in Exp. 3 (see scale). For those areas tested (IC, MGN, and undimmed portions of the profiles), * indicates significantly greater Mn2+ uptake on the visually-stimulated side of the brain (P<0.05; paired one-tailed t-tests). Solid profile lines denote±s.e.m of ratio data. Superior colliculus (SC) abbreviations: Zo — zonal layer; SuG — superficial gray; Op — optic nerve layer.

Similar articles

Cited by

References

    1. Alvestad S, Goa PE, Qu H, Risa Ø, Brekken C, Sonnewald U, Haraldseth O, Hammer J, Ottersen OP, HåBerg A. In vivo mapping of temporospatial changes in manganese enhancement in rat brain during epileptogenesis. Neuro-Image. 2007;38:57–66. - PubMed
    1. Angenstein F, Niessen HG, Goldschmidt J, Lison H, Altrock WD, Gundelfinger ED, Scheich H. Manganese-enhanced MRI reveals structural and functional changes in the cortex of bassoon mutant mice. Cerebral Cortex. 2007;17:28–36. - PubMed
    1. Batipps M, Miyaoka M, Shinohara M, Sokoloff L, Kennedy C. Comparative rates of local cerebral glucose utilization in the visual system of conscious albino and pigmented rats. Neurology. 1981;31:58–62. - PubMed
    1. Berkowitz BA, Roberts R, Goebel DJ, Luan H. Noninvasive and simultaneous imaging of layer-specific retinal functional adaptation by manganese-enhanced MRI. Investigative Ophthalmology and Visual Science. 2006;47(6):2668–2674. - PubMed
    1. Berkowitz BA, Roberts R, Luan H, Bissig D, Bui BV, Gradianu M, Calkins DJ, Vingrys AJ. Manganese-enhanced MRI studies of alterations of intraretinal ion demand in models of ocular injury. Investigative Ophthalmology and Visual Science. 2007a;48(8):3796–3804. - PMC - PubMed

Publication types