. 2011 Oct 15;58(4):975-83.
doi: 10.1016/j.neuroimage.2011.06.063. Epub 2011 Jul 1.

Population-averaged diffusion tensor imaging atlas of the Sprague Dawley rat brain

Affiliations

Population-averaged diffusion tensor imaging atlas of the Sprague Dawley rat brain

Jelle Veraart et al. Neuroimage. .

Abstract

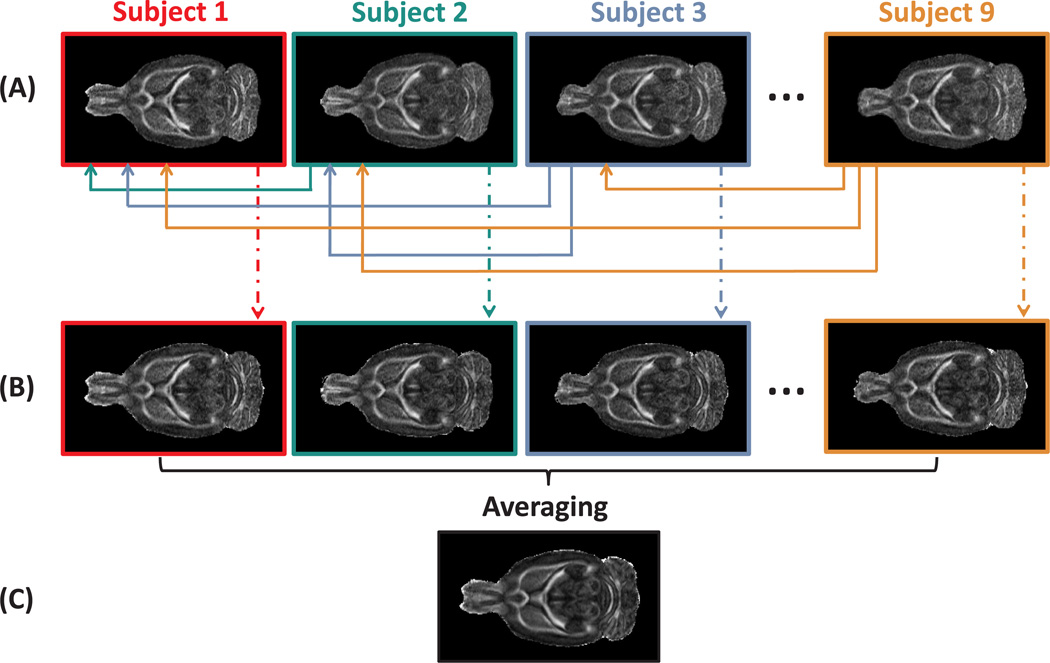
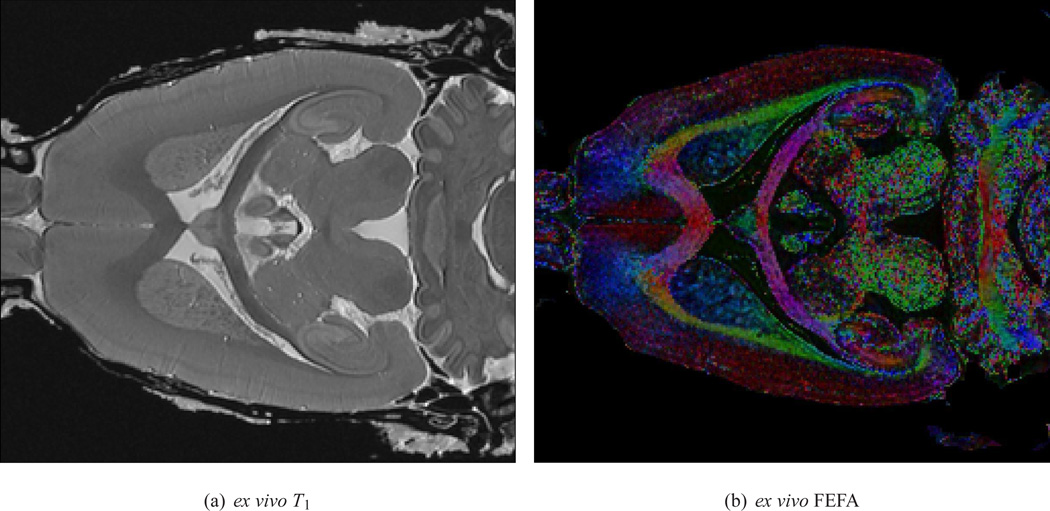
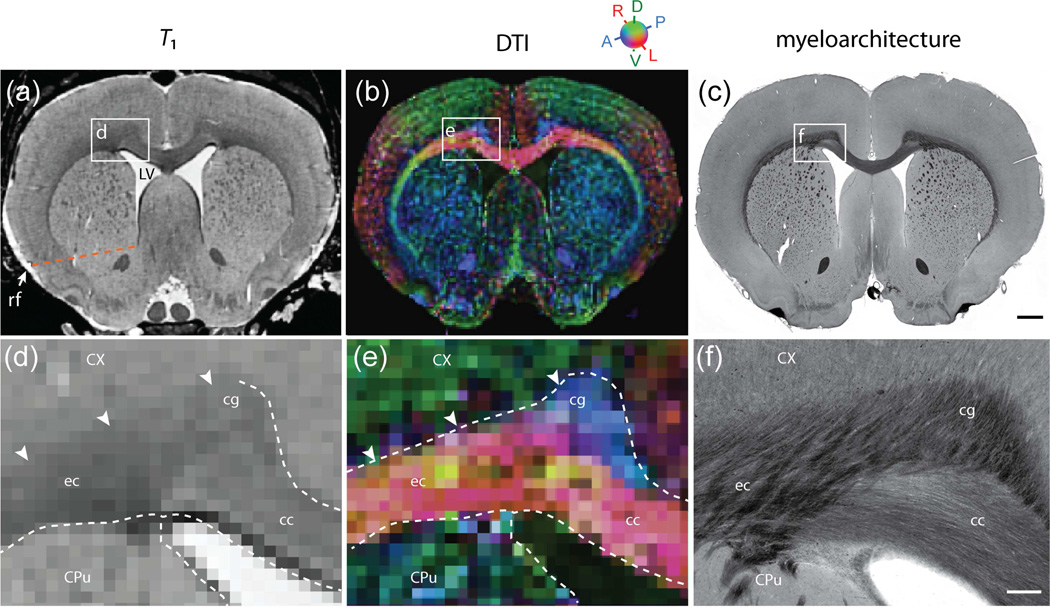
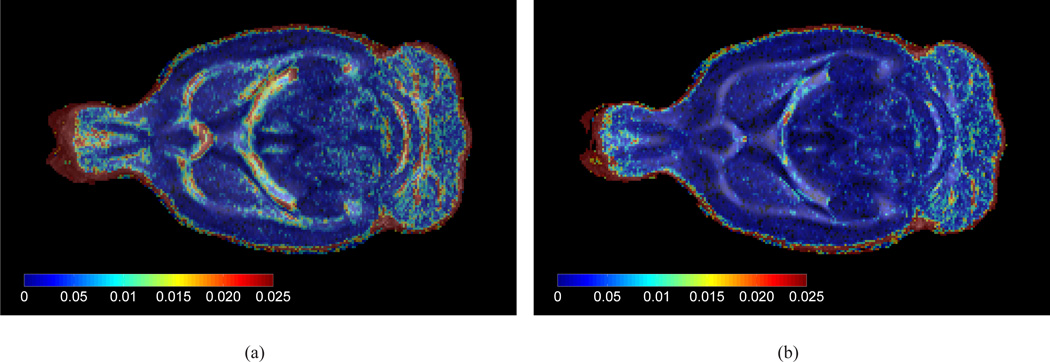
Rats are widely used in experimental neurobiological research, and rat brain atlases are important resources for identifying brain regions in the context of experimental microsurgery, tissue sampling, and neuroimaging, as well as comparison of findings across experiments. Currently, most available rat brain atlases are constructed from histological material derived from single specimens, and provide two-dimensional or three-dimensional (3D) outlines of diverse brain regions and fiber tracts. Important limitations of such atlases are that they represent individual specimens, and that finer details of tissue architecture are lacking. Access to more detailed 3D brain atlases representative of a population of animals is needed. Diffusion tensor imaging (DTI) is a unique neuroimaging modality that provides sensitive information about orientation structure in tissues, and is widely applied in basic and clinical neuroscience investigations. To facilitate analysis and assignment of location in rat brain neuroimaging investigations, we have developed a population-averaged three-dimensional DTI atlas of the normal adult Sprague Dawley rat brain. The atlas is constructed from high resolution ex vivo DTI images, which were nonlinearly warped into a population-averaged in vivo brain template. The atlas currently comprises a selection of manually delineated brain regions, the caudate-putamen complex, globus pallidus, entopeduncular nucleus, substantia nigra, external capsule, corpus callosum, internal capsule, cerebral peduncle, fimbria of the hippocampus, fornix, anterior commisure, optic tract, and stria terminalis. The atlas is freely distributed and potentially useful for several purposes, including automated and manual delineation of rat brain structural and functional imaging data.


Figures

Figure 1
Figure 1
An overview of the in vivo population-averaged template construction. In (A), the FA maps of the subjects, affinely aligned to an arbitrarily chosen subject, are shown. The deformation field which maps subject j onto subject i is calculated and denoted as Tij, with i < j, and j = 1 ⋯ 9. The calculation of the deformation fields was done with a nonrigid registration algorithm based on a viscous fluid model. Next, for subject i, an average mean deformation field is computed as the average deformation to all other subjects: Ti=j=19Tji, with Tji the inverse of Tij. The average deformation fields, Ti, are applied to the corresponding DTI datasets (B). The average of the deformed DTI datasets resulted in the population based atlas (C). In (B) and (C), the DTI datasets are represented by the FA maps.
Figure 2
Figure 2
(a) A single horizontal slice of the ex vivo T1 image, and (b) the direction encoded (DEC) FA map, with RGB-colors representing the orientation of the first eigenvector of the DTs and intensity values in proportion to the FA value, of a single ex vivo sample are shown. The red, green and blue color correspond to the mediolateral, dorsoventral, and anterioposterior orientations, respectively. These maps were used for the manual delineation of the anatomical structures.
Figure 3
Figure 3
Coronal ex vivo T1-weighted (a,d) and DTI (b,e) slices, shown together with corresponding images (c,f) of a coronal, myelin stained section from a different animal. White frames in (a–c) indicate the position of the enlarged images in (d–f). Images were manually segmented on basis of T1, supplemented by DTI contrast in regions where T1 contrast was insufficient. The detailed interpretation of DTI images was aided by inspection of myelin fiber orientations in corresponding histological section images. It not possible to distinguish the cingulum (cg) and corpus callosum (cc) in the T1 images, but the anterioposteriorly oriented fibers of the cg (e, f) are stand out in DT images (blue color in (b,e)). The dorsal boundary of the external capsule (ec) is ambiguous in T1-weighted images (arrowheads in (d)), but readily identified mediolaterally oriented diffusion orientations in DTI (red color in (b,e)). The dotted line in (a) indicates the imaginary boundary between the dorsal caudate putamen (CPu) and the nucleus accumbens, drawn as a line between the rhinal fissure and ventral tip of the lateral ventricle. Scalebars, 1mm and 250 µm.
Figure 4
Figure 4
(a) The average in vivo FA template (in grey colour scale) of a single horizontal slice after affine alignment of all subjects to a single, arbitrarily chosen, subject, overlaid with the intersubject FA variance map (shown in spectral colour scale). Blue regions indicate low variability, while red indicate high variability. (b) Compared to (a), the FA variance and average was calculated after warping each subject onto the population-averaged DTI template.
Figure 5
Figure 5
Similarity between pairs of DTI datasets (represented by the FA map), which were (I) not aligned (original data), (II) affinely aligned, (III) nonrigidly aligned to a single subject, and (IV) nonrigidly aligned to the population-averaged DTI brain template, was evaluated with the normalized correlation coefficient. Each set of FA maps resulted in 36 pairwise calculated normalized correlation coefficients, of which the median value is indicated by the red lines. The lower and upper edges of the boxes correspond to the 25th and 75th percentiles, respectively.
Figure 6
Figure 6
A single horizontal slice of the in vivo population-averaged FA template (in grey colour scale) overlaid with the anatomical variability magnitude (AVM) map (shown in spectral colour scale). The intensity levels in the AVM map denote distances in millimeters, and represent the average anatomical variability in the adult rat brain across the sample population. Blue regions indicate low anatomical variability, while red indicate high anatomical variability.
Figure 7
Figure 7
3D rendering images of the delineated brain structures: the nucleus accumbus (Acb), caudate putamen complex (CPu), globus pallidus (GP), entopeduncular nucleus (EP), substantia nigra (SN), external capsule (ec), corpus callosum (cc), internal capsule (ic), fimbria of the hippocampus (fi), fornix (f), posterior (acp) and anterior part (aca) of anterior commisure, optic tract (opt), cingulum (cg), and lateral ventricle (LV) were manually segmented with ITK-SNAP and visualized using AMIRA software®.
Figure 8
Figure 8
A horizontal and coronal section of the FA maps of the in vivo population based atlas and the ex vivo subject, respectively, are shown (a) to indicate the accurate alignment of both datasets after applying a nonrigid coregistration algorithm to minimize morphological differences between both samples. In (b), a 3D rendering of cc/ec, cg, and LV are superimposed onto (a); Coloring in accordance to Fig. 7.

Similar articles

Cited by

References

    1. Aggarwal M, Zhang J, Miller M, Sidman R, Mori S. Magnetic resonance imaging and micro-computed tomography combined atlas of developing and adult mouse brains for stereotaxic surgery. Neuroscience. 2009;162(4):1339–1350. - PMC - PubMed
    1. Alexander DC, Pierpaoli C, Basser PJ, Gee JC. Spatial transformations of diffusion tensor magnetic resonance images. IEEE Trans Med Imaging. 2001;20(11):1131–1139. - PubMed
    1. Amaral D, Lavenex P. Hippocampal neuroanatomy. In: Andersen P, Morris R, Amaral D, Bliss T, O’Keefe J, editors. The Hippocampus. New York: Oxford University Press; 2007. Ch. 3.
    1. Antonsen BT, Jiang Y, Veraart J, Van Dongen Y, Qu H, Urbach Y, Raber K, Nguyen HP, Sijbers J, von Hörsten S, Johnson GA, Leergaard TB. Altered ex vivo diffusion mri in basal ganglia of transgenic huntington’s disease rats. 7th Forum of European Neuroscience Abstracts 0.46.2. 2010 Jul
    1. Ashburner J, Friston K. Nonlinear spatial normalization using basis functions. Human Brain Mapping. 1999;7:254–266. - PMC - PubMed

Publication types

LinkOut - more resources